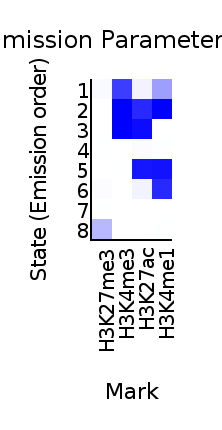
Minimum
# set the states with numbers
# states should be named later depending on the results
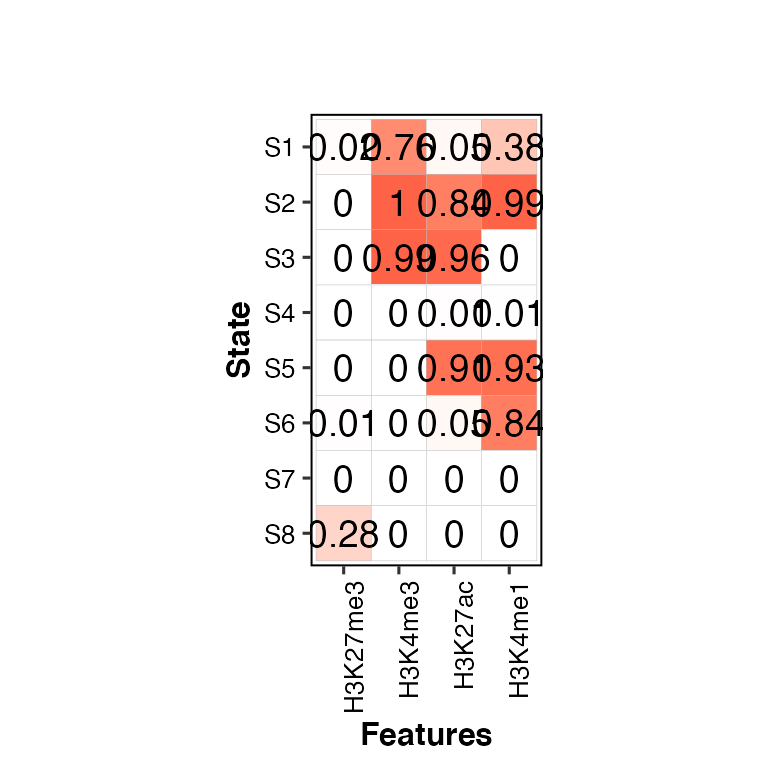
states <- paste("S", 1:8, sep = "")
# set the names of marks in the same order as in the emission files
# (they do not need to have the same name as in the file)
features <- c("H3K27me3", "H3K4me3", "H3K27ac", "H3K4me1")
# call emission2hm()
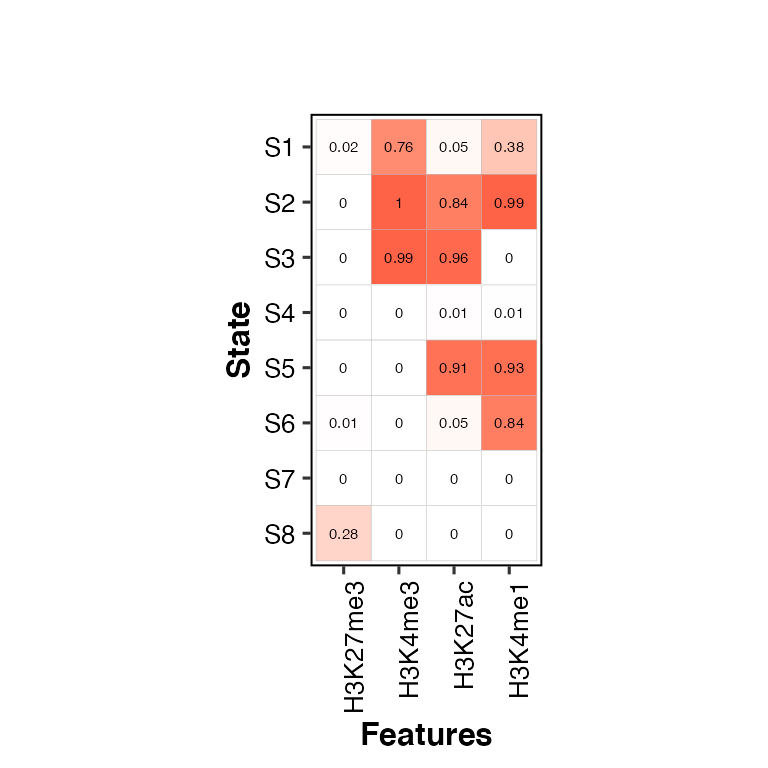
emission2hm(data = emissions, features = features, states = states)
## Loading required package: dplyr
##
## Attaching package: 'dplyr'
## The following objects are masked from 'package:stats':
##
##     filter, lag
## The following objects are masked from 'package:base':
##
##     intersect, setdiff, setequal, union
## Loading required package: magrittr
## Loading required package: reshape2
## Loading required package: ggplot2
## Loading required package: ggpubr
## Using State as id variables

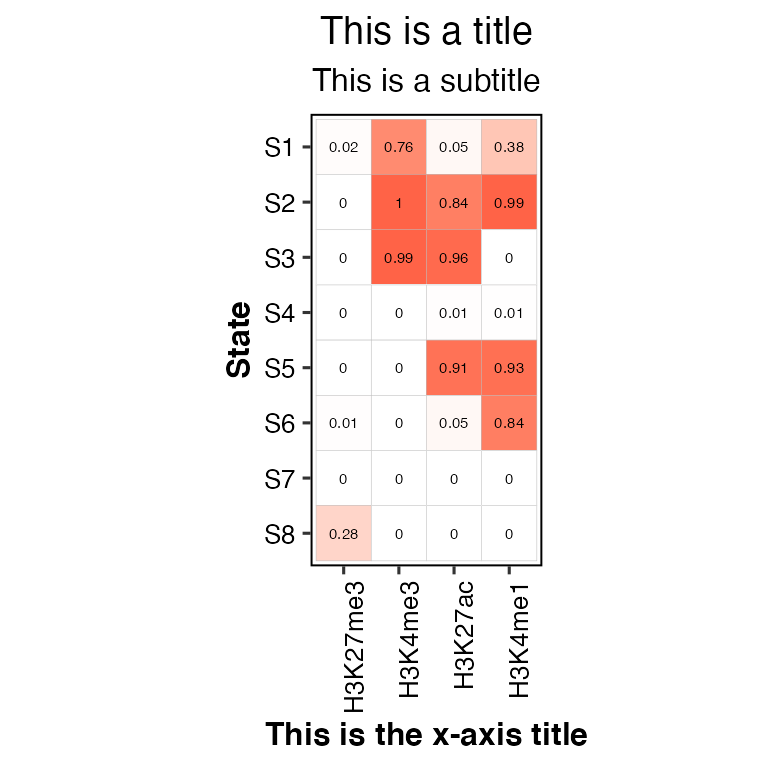
Customize the output
# change title subtitle and xlab
emission2hm(data = emissions, features = features, states = states, title = "This is a title", subtitle = "This is a subtitle", xlab = "This is the x-axis title")
## Using State as id variables
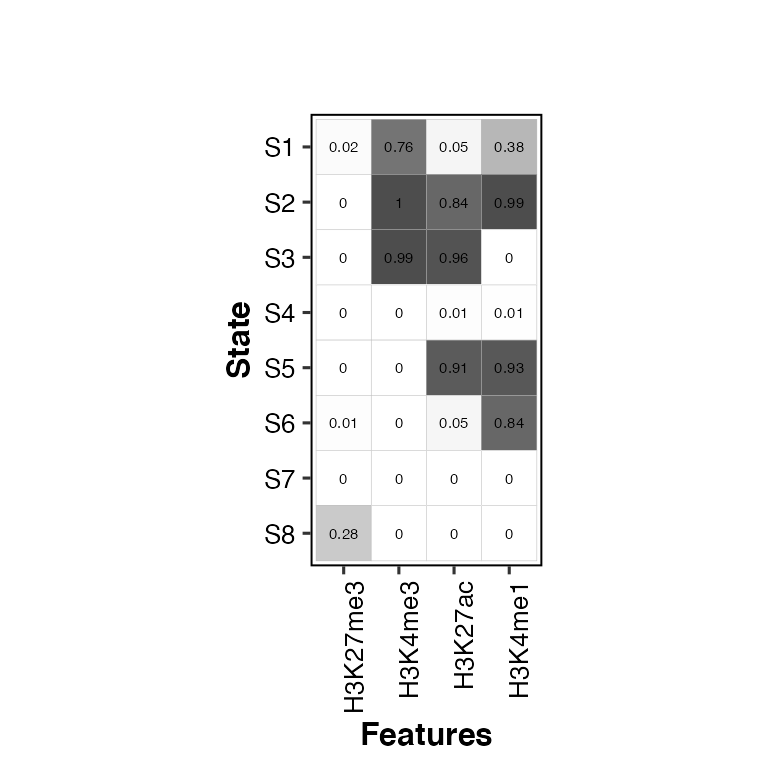
# change color of the heatmap: color = "gray30"
emission2hm(data = emissions, features = features, states = states, color = "gray30")
## Using State as id variables
# change the size of the likelihood labels (default: lh_size = 2)
emission2hm(data = emissions, features = features, states = states, lh_size = 5)
## Using State as id variables
# without likelihood labels: show_lh = F
emission2hm(data = emissions, features = features, states = states, show_lh = F)
## Using State as id variables