Minimum
# set the states with numbers
# states should be named later depending on the results
states <- paste("S", 1:8, sep = "")

# set the names of the regions in the same order as in the overlap file
# (they do not need to have the exact same name as in the file)
# in this case, the regions are the default from ChromHMM hg38
regions <- c("% Genome", "CpG islands", "Exon RefSeq", "Gene RefSeq", "TES RefSeq", "TSS RefSeq", "TSS +/- 2kb RefSeq")
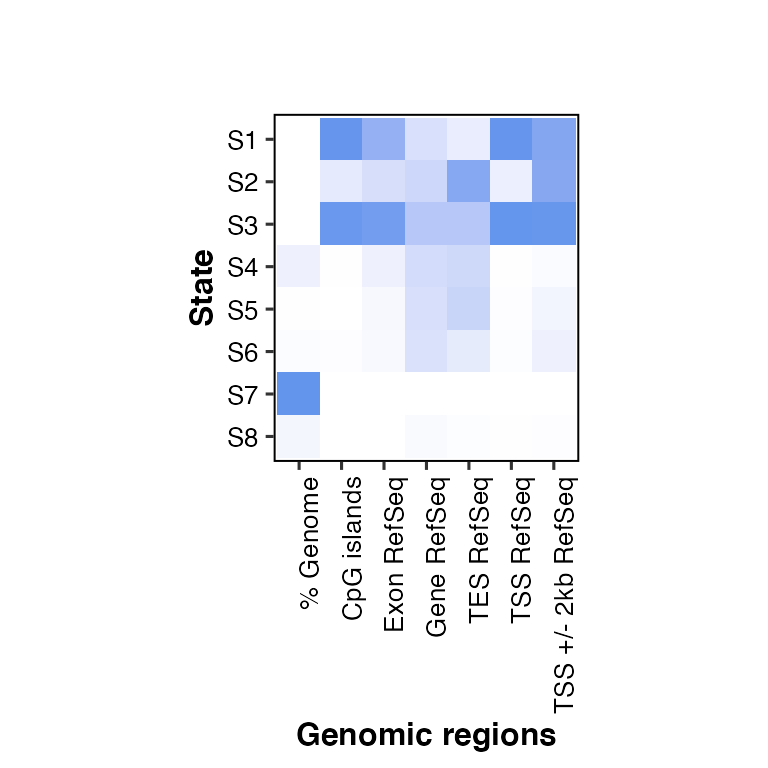
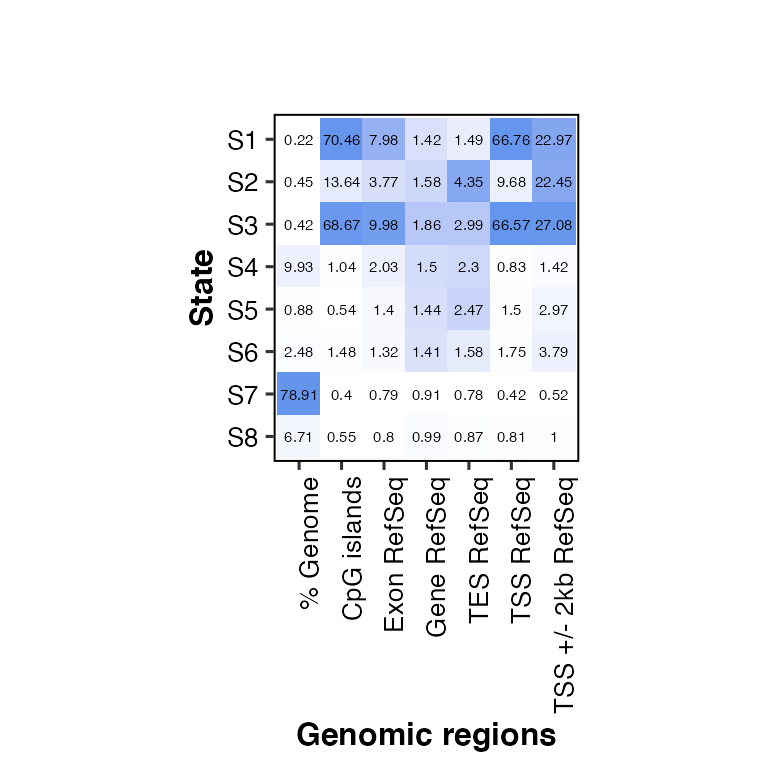
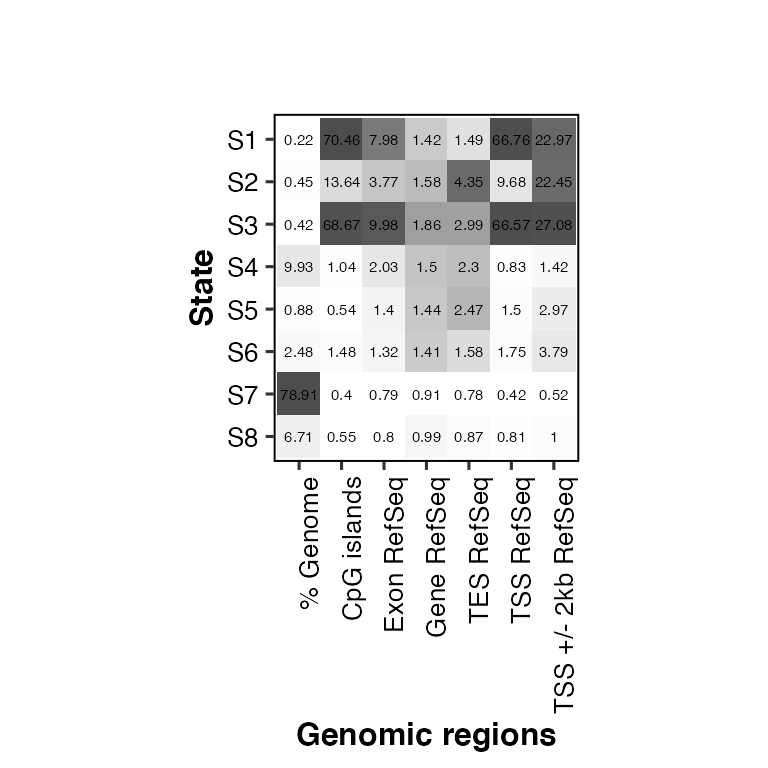
# call overlap2hm()
overlap2hm(data = overlaps, states = states, regions = regions)
## Loading required package: dplyr
##
## Attaching package: 'dplyr'
## The following objects are masked from 'package:stats':
##
##     filter, lag
## The following objects are masked from 'package:base':
##
##     intersect, setdiff, setequal, union
## Loading required package: magrittr
## Loading required package: reshape2
## Loading required package: ggplot2
## Loading required package: ggpubr
## Using State as id variables

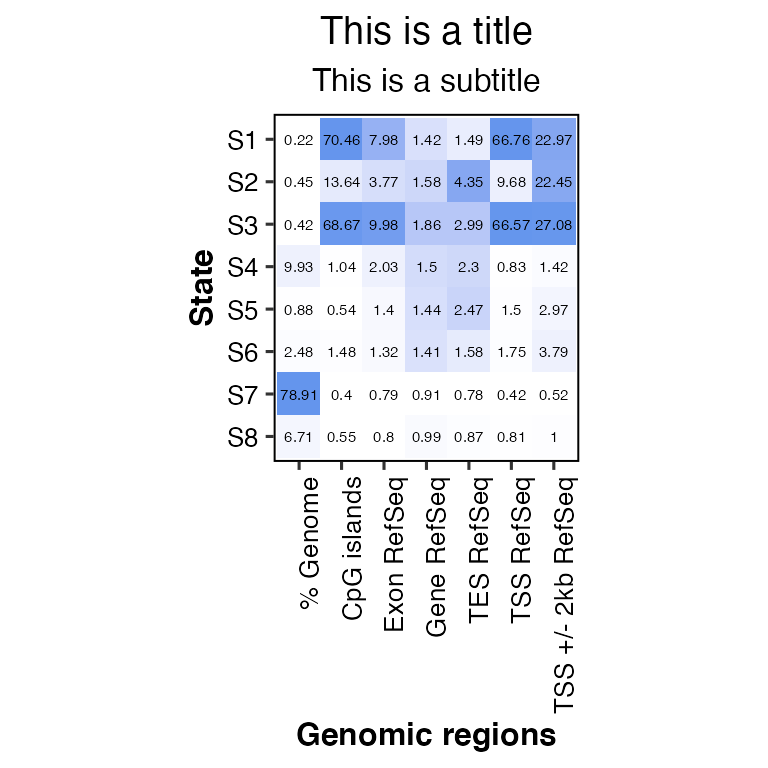
Customize the output
# change title and subtitle
overlap2hm(data = overlaps, states = states, regions = regions, title = "This is a title", subtitle = "This is a subtitle")
## Using State as id variables
# change color of the heatmap: color = "gray30"
overlap2hm(data = overlaps, states = states, regions = regions, color = "gray30")
## Using State as id variables
#if(!require(patchwork)){ devtools::install_github("thomasp85/patchwork") }
library(patchwork) # to show the plots side-by-side
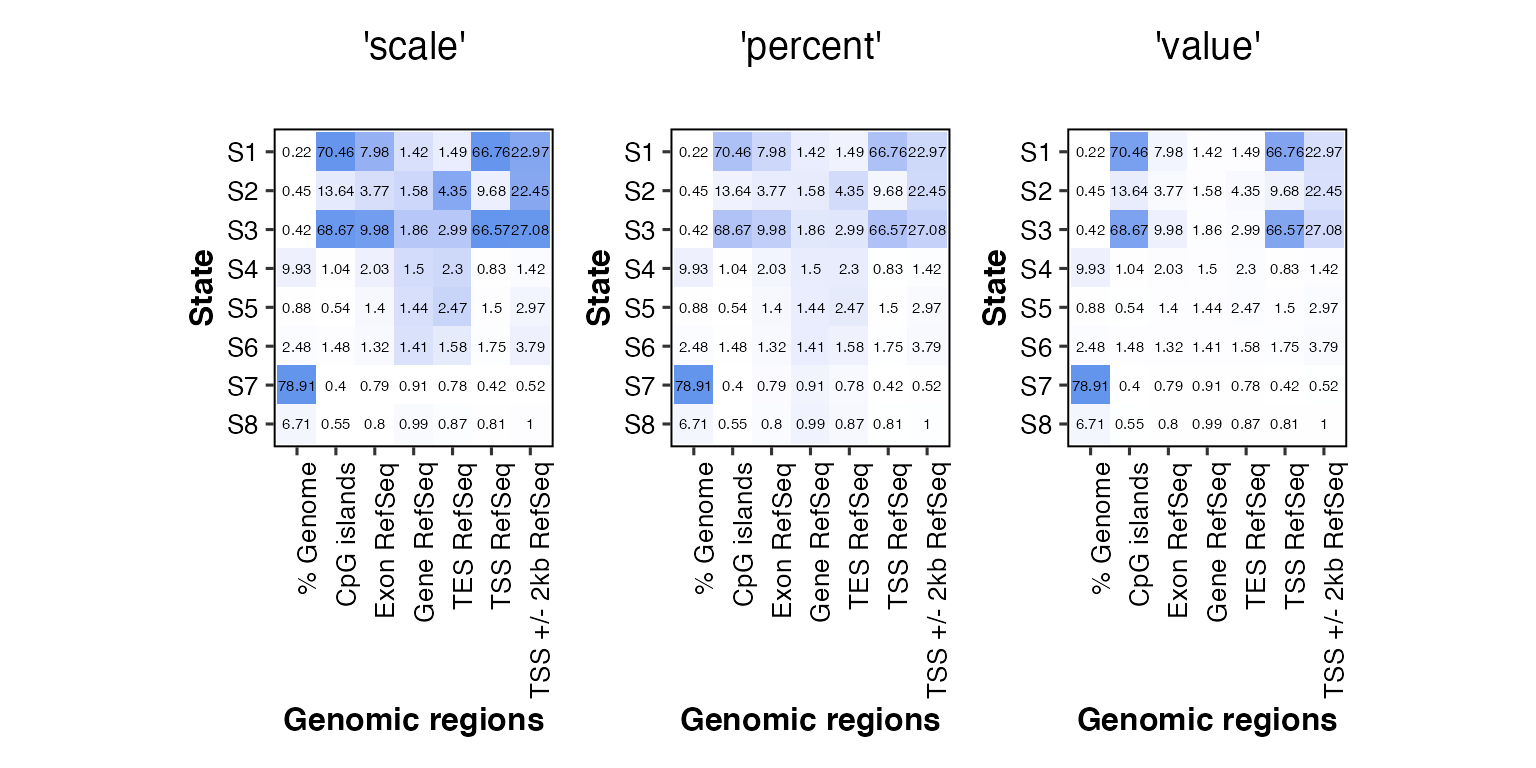
# change the scaling of the color (by default, chromHMM normalizes each column separately)
# must be one of 'scale' (default), 'percent' or 'value'
# the numbers showing the enrichment don't change
overlap2hm(data = overlaps, states = states, regions = regions,
scale_color = "scale", title = "'scale'") + # scale by column (default in ChromHMM and chromHMMviewR)
overlap2hm(data = overlaps, states = states, regions = regions,
scale_color = "percent", title = "'percent'") + # percentage of each cell within its column
overlap2hm(data = overlaps, states = states, regions = regions,
scale_color = "value", title = "'value'") # use the enrichment value in each cell
## Using State as id variables
## Using State as id variables
## Using State as id variables
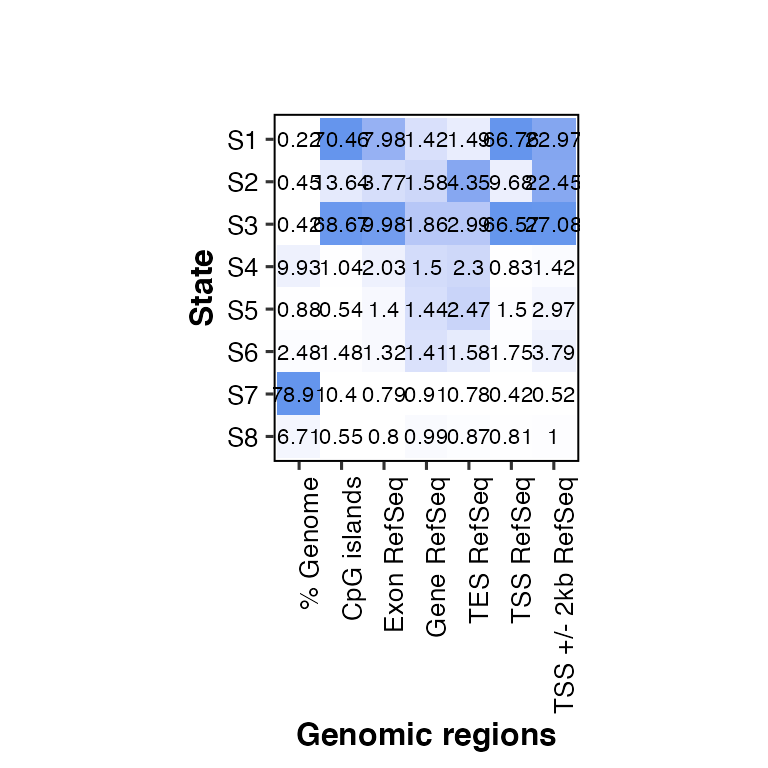
# change the size of the likelihood labels (default: score_size = 2)
overlap2hm(data = overlaps, states = states, regions = regions, score_size = 3)
## Using State as id variables
# without likelihood labels: show_score = F
overlap2hm(data = overlaps, states = states, regions = regions, show_score = F)
## Using State as id variables