neighbor2hm()
Adrià Mitjavila Ventura
13 May, 2021
Source:vignettes/04-neighbor2hm.Rmd
04-neighbor2hm.RmdDefault overlap from ChromHMM
knitr::include_graphics("../demodata/conditionX_8_RefSeqTSS_neighborhood.png")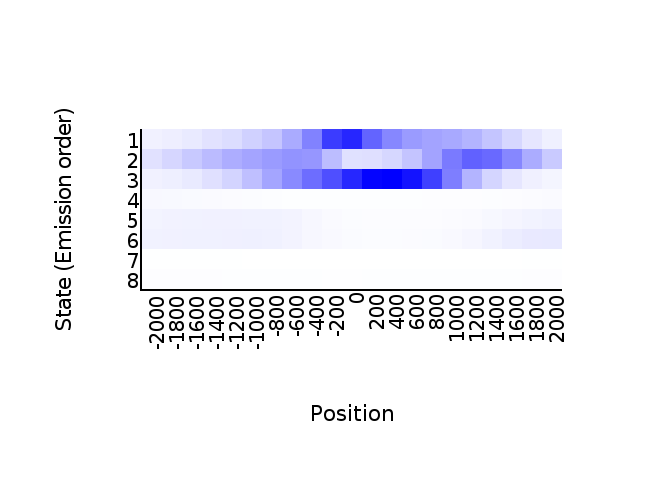
Run chromHMMviewR::neighbor2hm()
Install and load
# install devtools if not installed
if(!require(devtools)){ install.packages("devtools") }

# install chromHMMviewR if not installed
if(!require(chromHMMviewR)){ devtools::install_github("amitjavilaventura/chromHMMviewR") }
# load chromHMMviewR
library(chromHMMviewR)
Read and explore the data
# read neighborhood file from the demodata
tss_neighbor <- read.delim("../demodata/conditionX_8_RefSeqTSS_neighborhood.txt")

# head
head(tss_neighbor)
## State..Emission.order. X.2000 X.1800 X.1600 X.1400 X.1200 X.1000
## 1 1 4.68205 5.66775 7.02308 9.24089 10.93848 14.62115
## 2 2 9.62928 12.94596 17.09522 21.17623 25.56435 28.20540
## 3 3 4.74970 5.46034 7.07016 9.91997 13.65447 19.92697
## 4 4 2.52862 2.37108 2.17270 1.94729 1.70008 1.41940
## 5 5 3.97564 4.32704 4.48207 4.63365 4.66810 4.61642
## 6 6 4.58853 4.72869 4.85287 4.87008 5.03730 5.18853
## X.800 X.600 X.400 X.200 X0 X200 X400 X600
## 1 18.13953 26.27152 38.82544 60.14110 66.75348 47.91574 37.33321 31.21369
## 2 31.13991 33.60353 32.52527 20.78724 9.67705 10.16159 12.81630 18.51470
## 3 28.13560 36.40225 45.04597 54.18279 66.57550 77.11185 78.38811 72.64496
## 4 1.14700 0.94985 0.86079 0.82885 0.82916 0.84083 0.87062 0.91914
## 5 4.51996 4.02042 2.93177 1.99471 1.49862 1.40560 1.35048 1.27124
## 6 4.92049 4.05000 2.90410 2.20697 1.75205 1.53811 1.51844 1.61557
## X800 X1000 X1200 X1400 X1600 X1800 X2000
## 1 28.61254 26.87389 23.50610 18.35858 12.75928 8.13199 5.22966
## 2 28.56710 41.10359 48.70602 46.35158 37.32285 25.91922 16.84954
## 3 58.97599 39.94095 23.55269 13.48769 8.00559 5.03975 3.65473
## 4 0.96797 1.02938 1.10432 1.22132 1.38899 1.60519 1.88465
## 5 1.34359 1.57441 1.99471 2.70784 3.47610 4.24435 4.82313
## 6 1.87500 2.32992 3.25082 4.61557 6.07992 7.18525 7.29836
Call neighbor2hm()
Minimum run
# set the states with numbers
# states should be named later depending on the results
states <- paste("S", 1:8, sep = "")
# call neighbor2hm()
neighbor2hm(data = tss_neighbor, states = states)
## Loading required package: dplyr##
## Attaching package: 'dplyr'## The following objects are masked from 'package:stats':
##
## filter, lag## The following objects are masked from 'package:base':
##
## intersect, setdiff, setequal, union## Loading required package: ggplot2## Loading required package: stringr## Loading required package: magrittr## Loading required package: reshape2## Loading required package: ggpubr## Loading required package: purrr##
## Attaching package: 'purrr'## The following object is masked from 'package:magrittr':
##
## set_names## Using State as id variables
From a file
# call neighbor2hm()
neighbor2hm(data = "../demodata/conditionX_8_RefSeqTSS_neighborhood.txt", states = states)
## Using State as id variables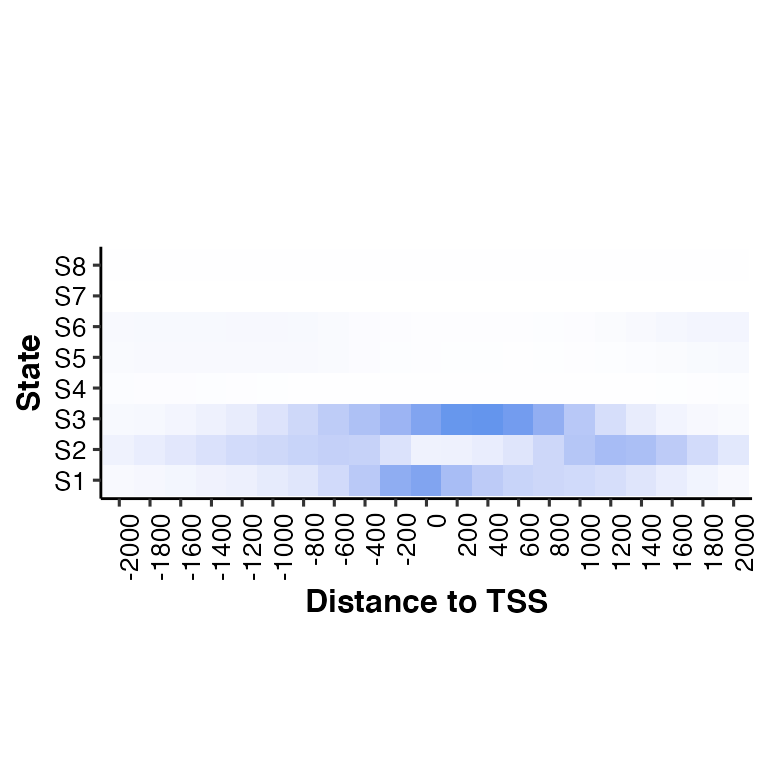
Customize the output
# change title, subtitle and xlab
neighbor2hm(data = tss_neighbor, states = states,
            title = "This is a title", subtitle = "This is a subtitle",
            xlab = "This is the x-axis title")
## Using State as id variables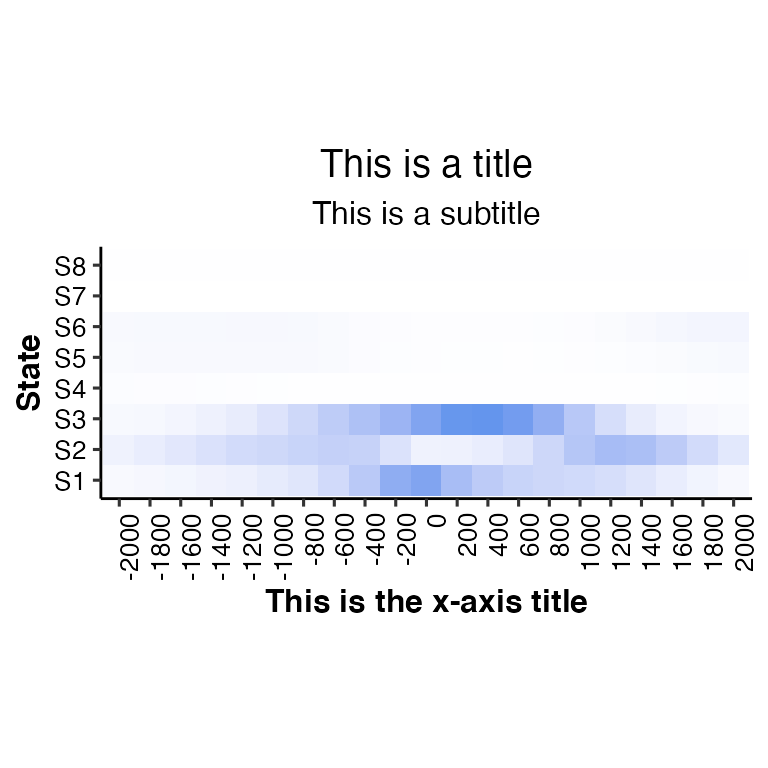
# change color of the heatmap: color = "gray30"
neighbor2hm(data = tss_neighbor, states = states, color = "gray30")
## Using State as id variables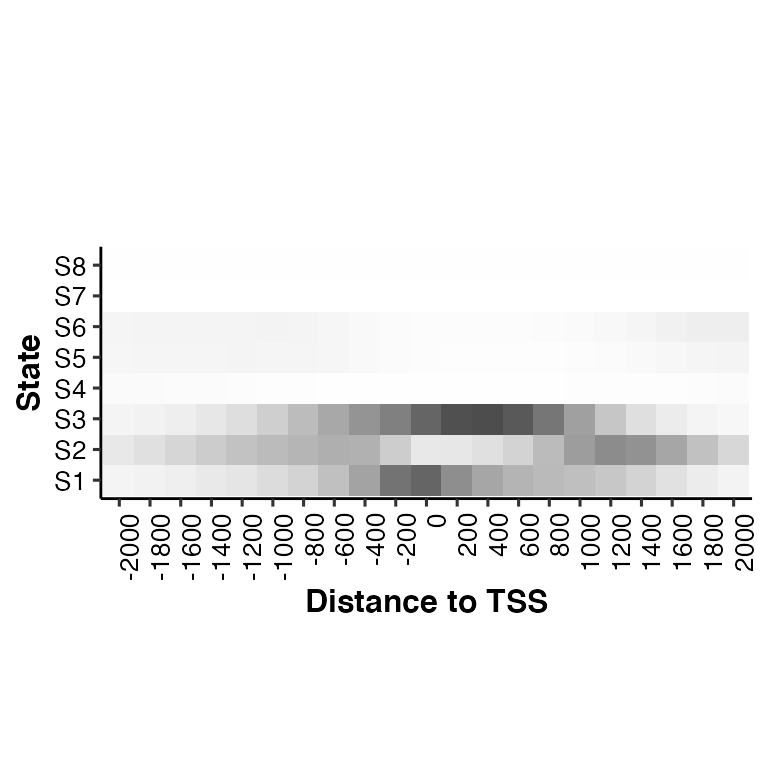
# show the enrichment values in each cell
neighbor2hm(data = tss_neighbor, states = states, show_score = T)
## Using State as id variables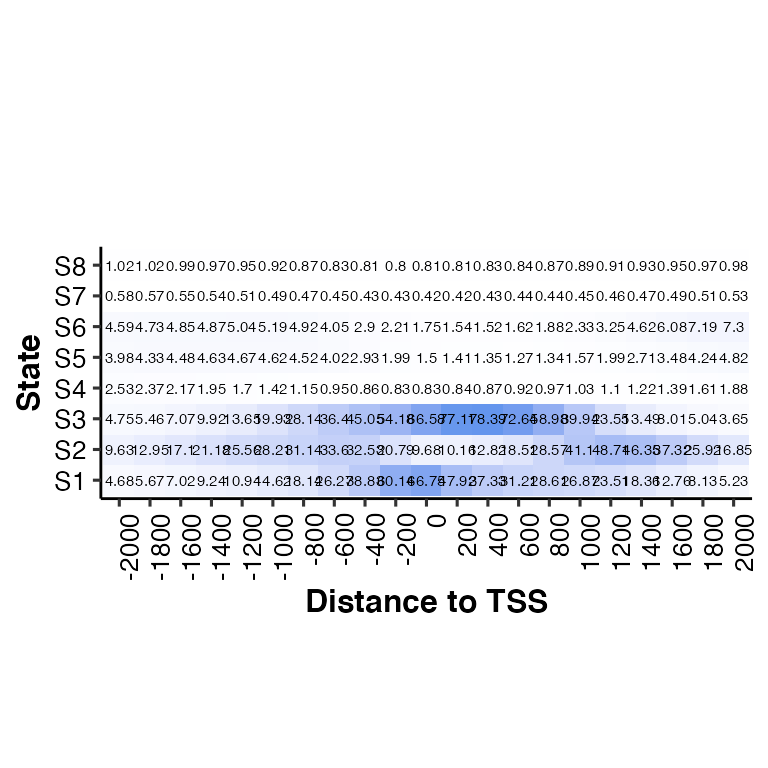
# change the size of the erichment values (default: score_size = 2)
neighbor2hm(data = tss_neighbor, states = states, show_score = T, score_size = 1)
## Using State as id variables