stat_info_boxplot()
Adrià Mitjavila Ventura
04-stat_info_boxplot.RmdLast updated: 2026-02-03
# Load ggplot2
library(ggplot2)

# Load ggmitji
library(ggmitji)

# Load patchwork (to put plots together)
library(patchwork)
# Create base boxplot with geom_boxplot, stat_boxplot or stat_summary_boxplot
p <- ggplot(mpg, aes(class, hwy)) + stat_summary_boxplot()
p + labs(title = "Normal boxplot")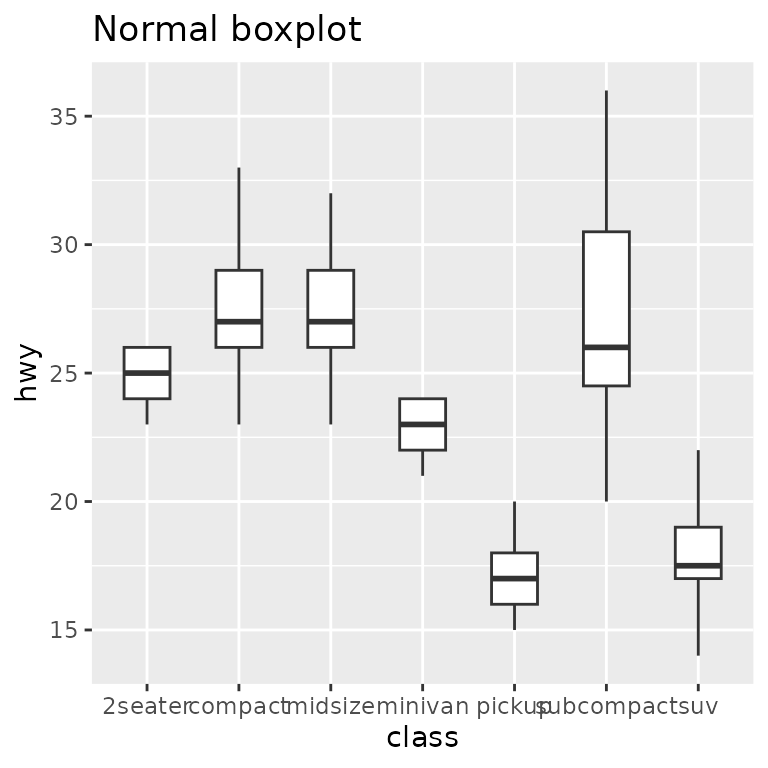
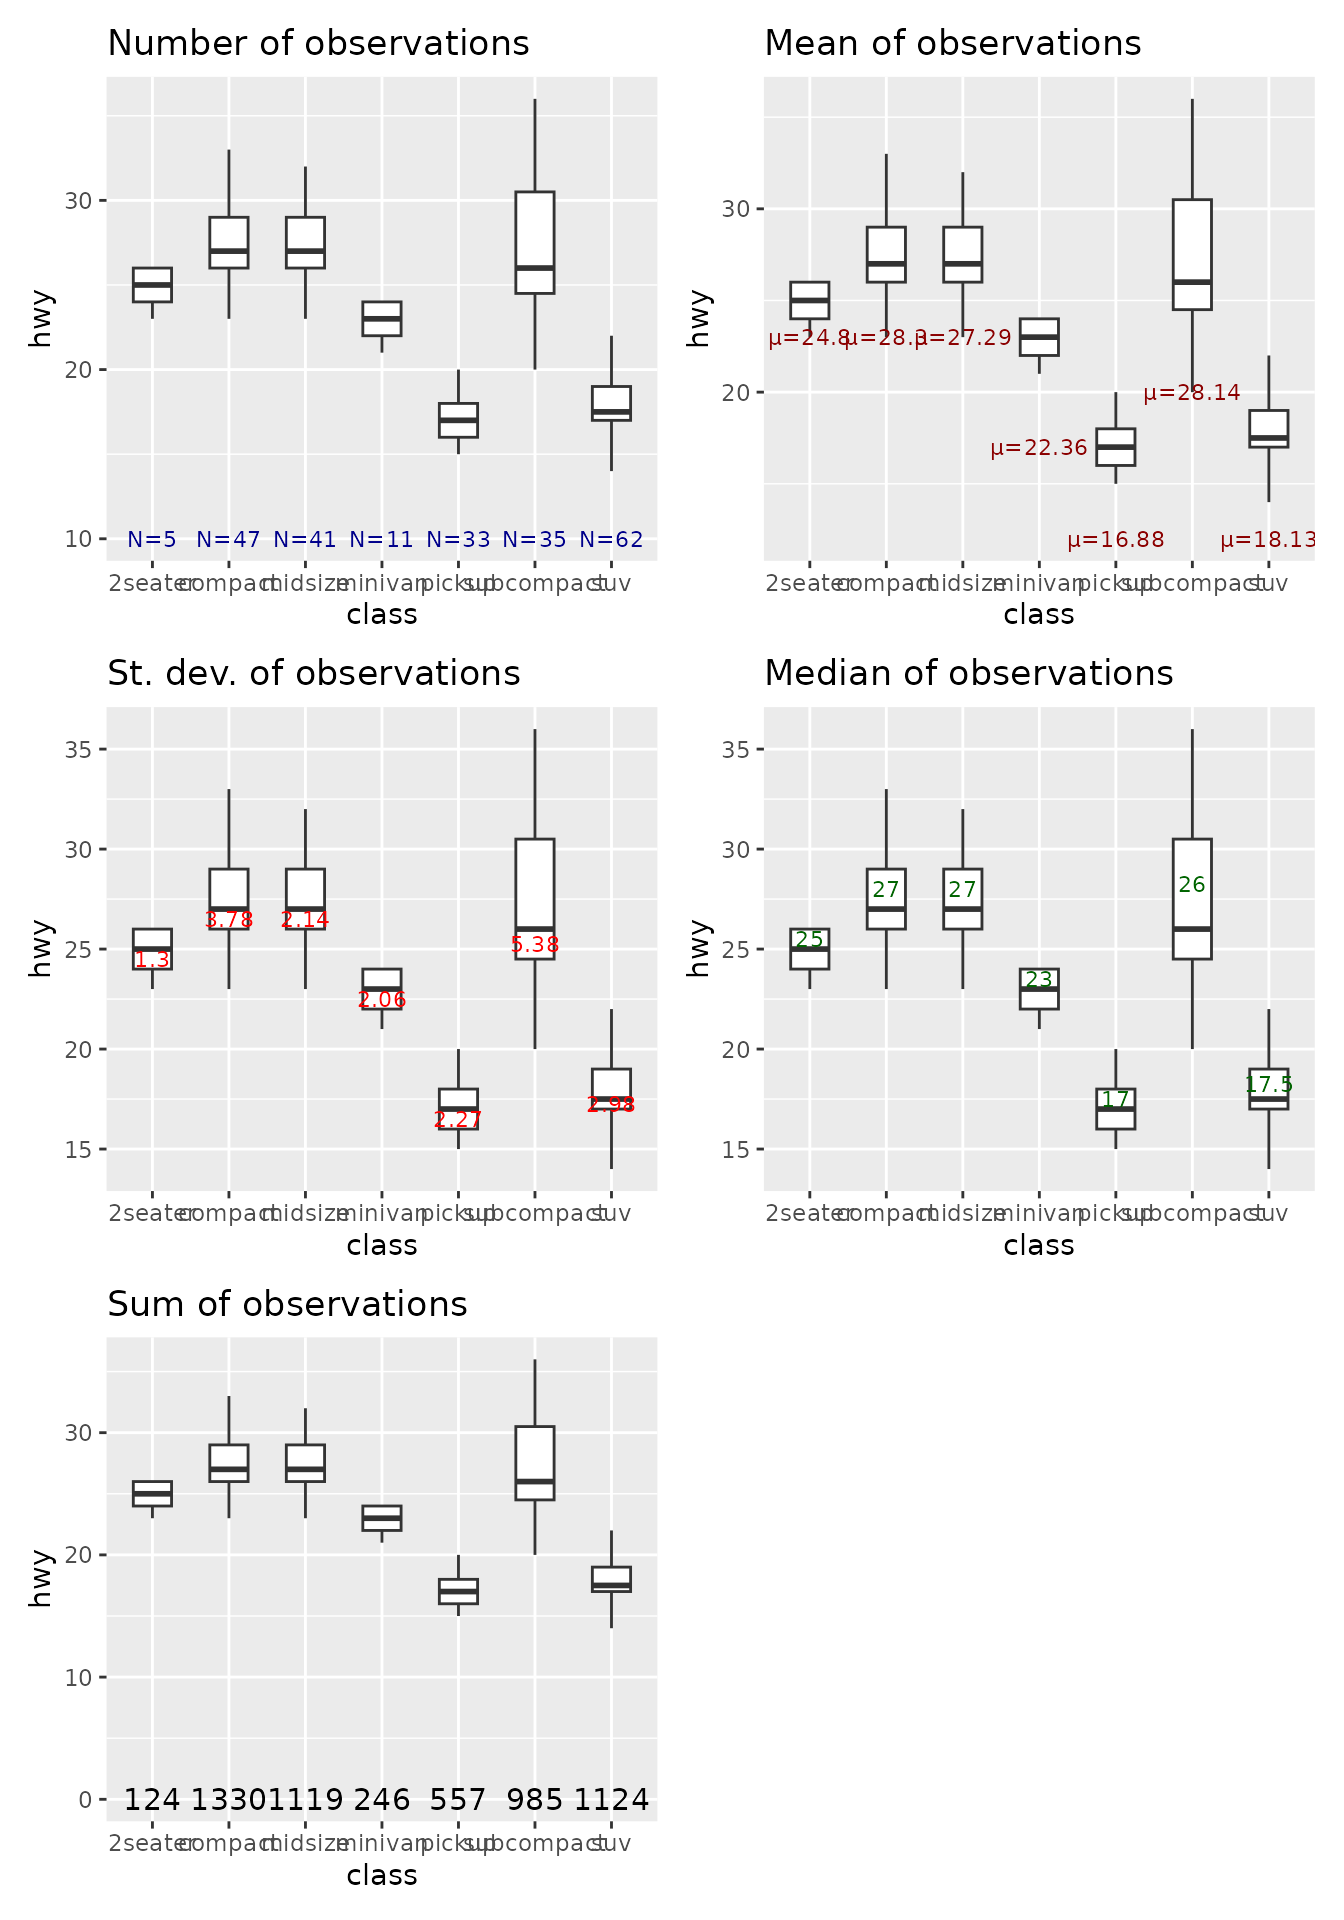
p + stat_info_boxplot(statistic = "n", label = "N=", y = 10, text_color = "darkblue", text_size = 3) + labs(title = "Number of observations") +
p + stat_info_boxplot(statistic = "mean", label = "µ=", y = "min", text_color = "darkred", text_size = 3) + labs(title = "Mean of observations") +
p + stat_info_boxplot(statistic = "sd", label = "", y = "lower", text_color = "red", text_size = 3) + labs(title = "St. dev. of observations") +
p + stat_info_boxplot(statistic = "median", label = "", y = "upper", text_color = "darkgreen", text_size = 3) + labs(title = "Median of observations") +
p + stat_info_boxplot(statistic = "sum", label = "", y = 0, text_color = "black", text_size = 4) + labs(title = "Sum of observations") +

  patchwork::plot_layout(ncol = 2, nrow = 3)