stat_point_boxplot()
Adrià Mitjavila Ventura
05-stat_point_boxplot.RmdLast updated: 2026-02-03
# Load ggplot2
library(ggplot2)

# Load ggmitji
library(ggmitji)

# Load patchwork (to put plots together)
library(patchwork)
# Create base boxplot with geom_boxplot, stat_boxplot or stat_summary_boxplot
p <- ggplot(mpg, aes(class, hwy)) + stat_summary_boxplot()
p + labs(title="Boxplot made with stat_summary_boxplot()")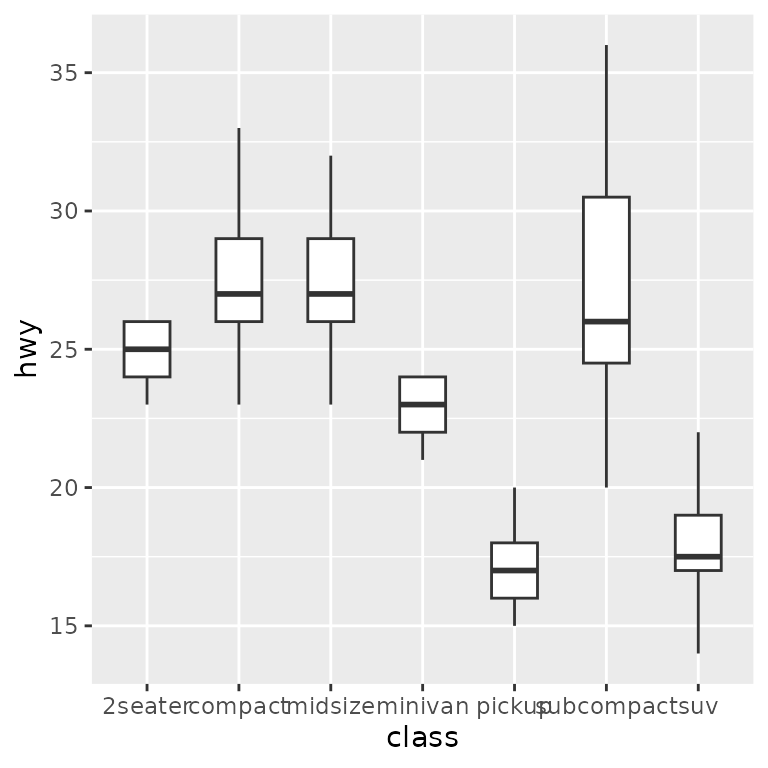
p + stat_point_boxplot(stat = "mean") + labs(title = "Boxplots with mean of observations")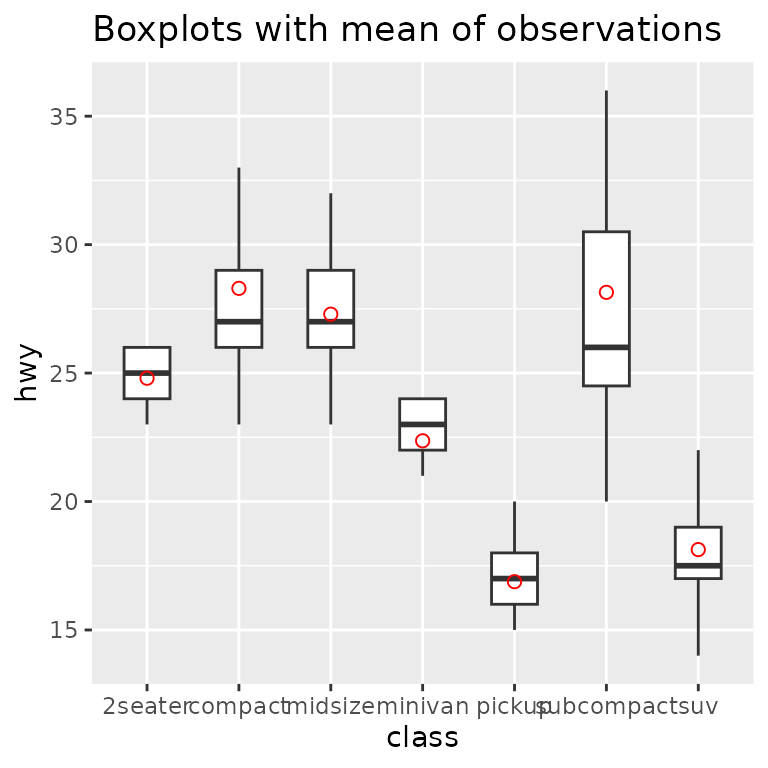
p + stat_point_boxplot(stat = "median") + labs(title = "Boxplots with median of observations")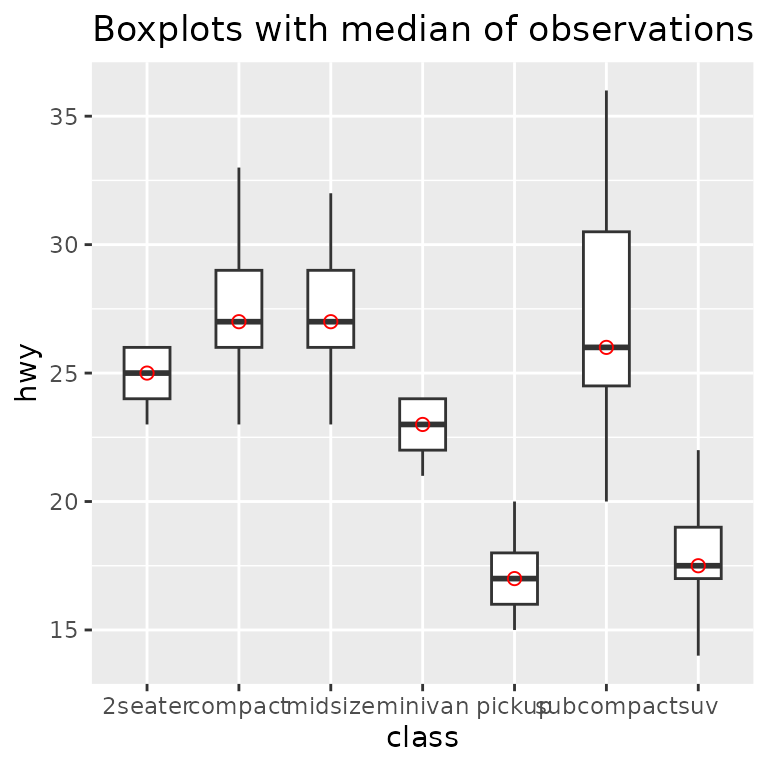
p + stat_point_boxplot(stat = "min") + labs(title = "Boxplots with smallest observation")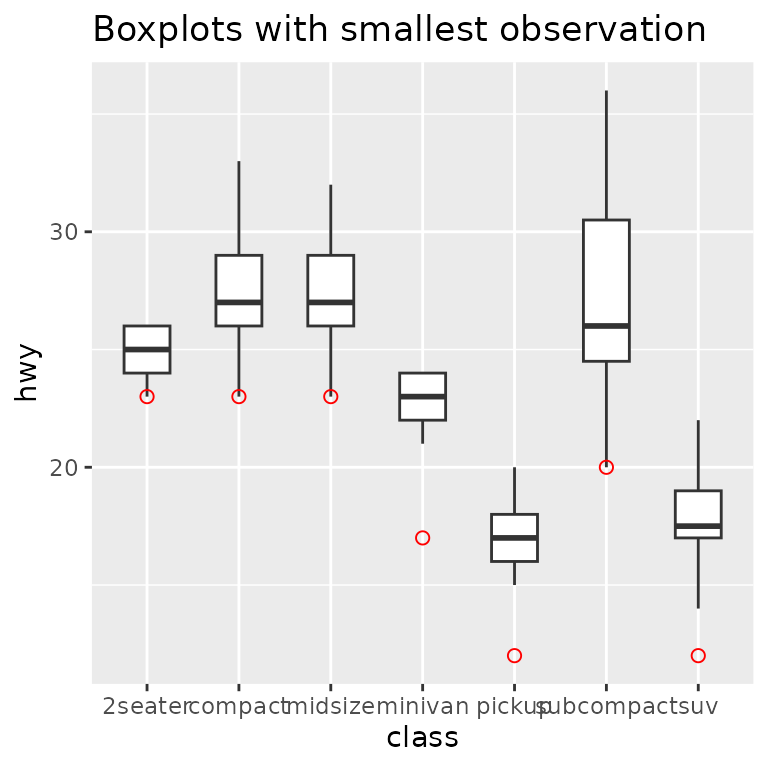
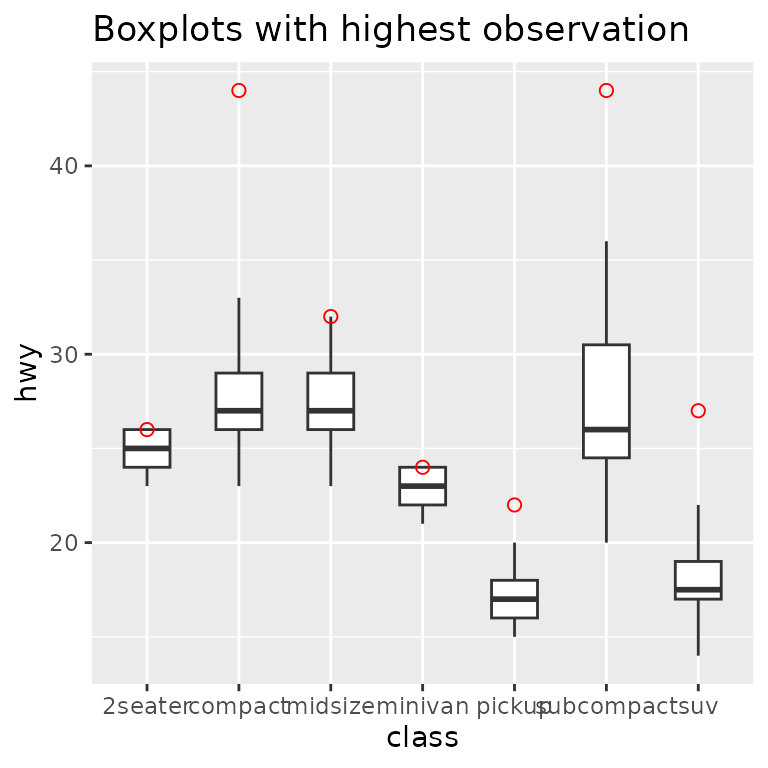
p + stat_point_boxplot(stat = "max") + labs(title = "Boxplots with highest observation")