shaded_2d_venn()
Adrià Mitjavila Ventura
06-shaded_2d_venn.RmdLast updated: 2026-02-03
# Load ggplot2
library(ggplot2)

# Load ggmitji
library(ggmitji)

# Load patchwork (to put plots together)
library(patchwork)
areas <-
  shaded_2d_venn(highlight = "all", color = "white", line.col = "black") +
  annotate("text", label = "AB", x = .5, y = .5, hjust = .5, vjust = .5) +
  annotate("text", label = "AnoB", x = .2, y = .5, hjust = .5, vjust = .5) +
  annotate("text", label = "noAB", x = .8, y = .5, hjust = .5, vjust = .5) +
  annotate("text", label = "Name of each area", x = .5, y = 1.06, hjust = .5, vjust = 0, fontface = "bold", size = 8) +
  coord_cartesian(ylim = c(0, 1))
areas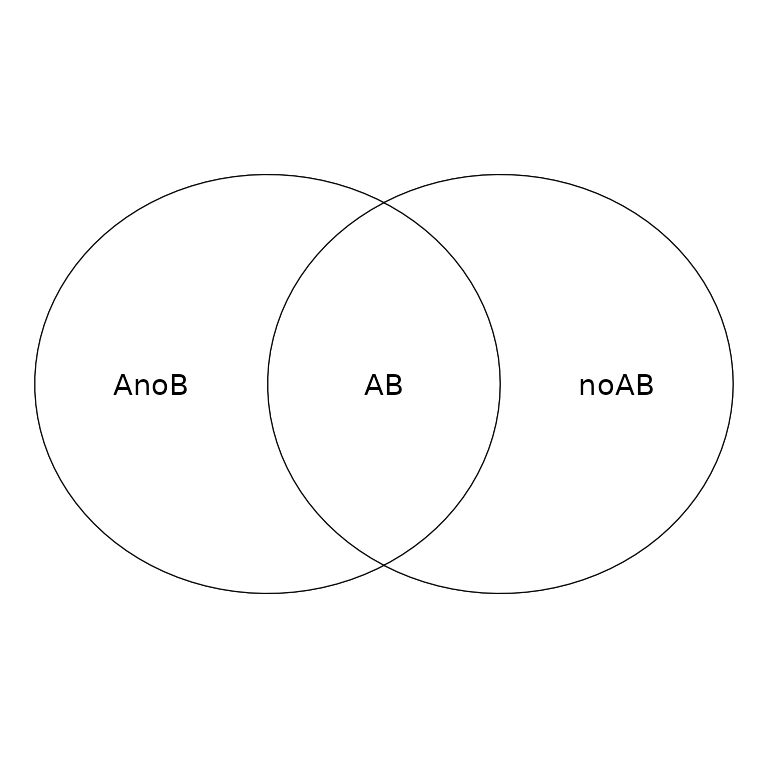
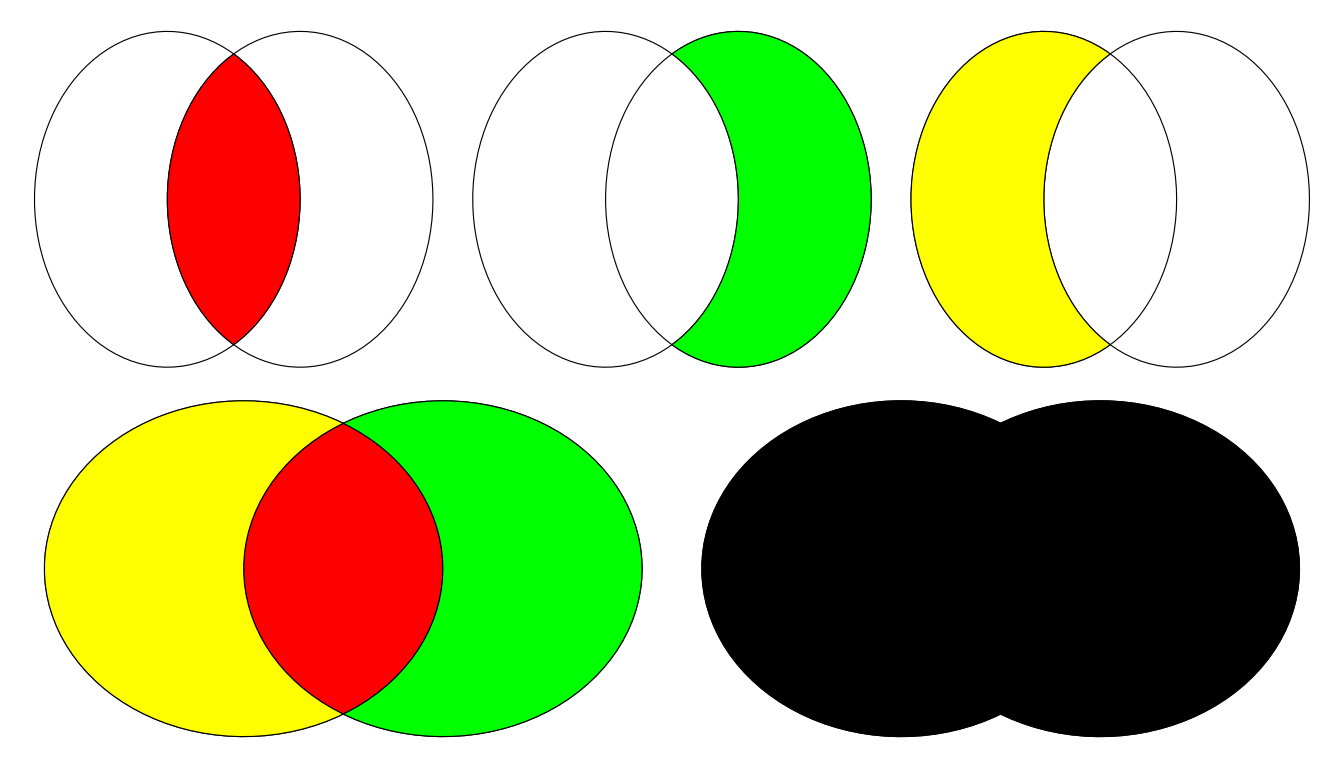
v1 <- shaded_2d_venn(highlight = "AB", color = "red")
v2 <- shaded_2d_venn(highlight = "noAB", color = "green")
v3 <- shaded_2d_venn(highlight = "AnoB", color = "yellow")
v4 <- shaded_2d_venn(highlight = c("AB", "AnoB", "noAB"), c("red", "yellow", "green"))
v5 <- shaded_2d_venn(highlight = "all", color = "black", line.col = "white")
(v1 + v2 + v3) / (v4 + v5)