Run expressionCor()
Required input
The input for expressionCor() is a data frame with a Geneid column and several columns with expression values of each sample. It is required that the values in the Geneid column are unique.
expr <- read.delim("../testdata/tpm.tsv")
expr[1:5,1:5]
## Geneid cond1_rep1 cond1_rep2 cond2_rep1 cond2_rep2
## 1 DDX11L1 0.0000000 0.000000 0.000000 0.000000
## 2 WASH7P 8.6190283 5.066649 5.182149 1.334332
## 3 MIR6859-1 76.1065829 3.728237 0.000000 2.945561
## 4 MIR1302-2HG 0.2112001 0.000000 0.000000 0.000000
## 5 MIR1302-2 0.0000000 0.000000 0.000000 0.000000
Groups and facets
expressionCor() allows to use groups, which then will be used to separate the correlation plots into facets. To enable this, set the parameter by_groups to TRUE. This option requires an extra column named group in which each row will have a determined value.
expr2 <- expr %>% dplyr::mutate(group = c(rep(c("group1", "group2", "group3"), nrow(expr)/3), "group1", "group2"))
head(expr2)
## Geneid cond1_rep1 cond1_rep2 cond2_rep1 cond2_rep2 cond3_rep1 cond3_rep2
## 1 DDX11L1 0.0000000 0.000000 0.0000000 0.000000 0.0000000 0.000000
## 2 WASH7P 8.6190283 5.066649 5.1821493 1.334332 1.9376567 4.092955
## 3 MIR6859-1 76.1065829 3.728237 0.0000000 2.945561 0.0000000 3.388224
## 4 MIR1302-2HG 0.2112001 0.000000 0.0000000 0.000000 0.0000000 0.000000
## 5 MIR1302-2 0.0000000 0.000000 0.0000000 0.000000 0.0000000 0.000000
## 6 FAM138A 0.0000000 0.000000 0.1852678 0.000000 0.2386085 0.000000
## group
## 1 group1
## 2 group2
## 3 group3
## 4 group1
## 5 group2
## 6 group3
expressionCor(df = expr2, samples = colnames(expr2)[-1], by_groups = T)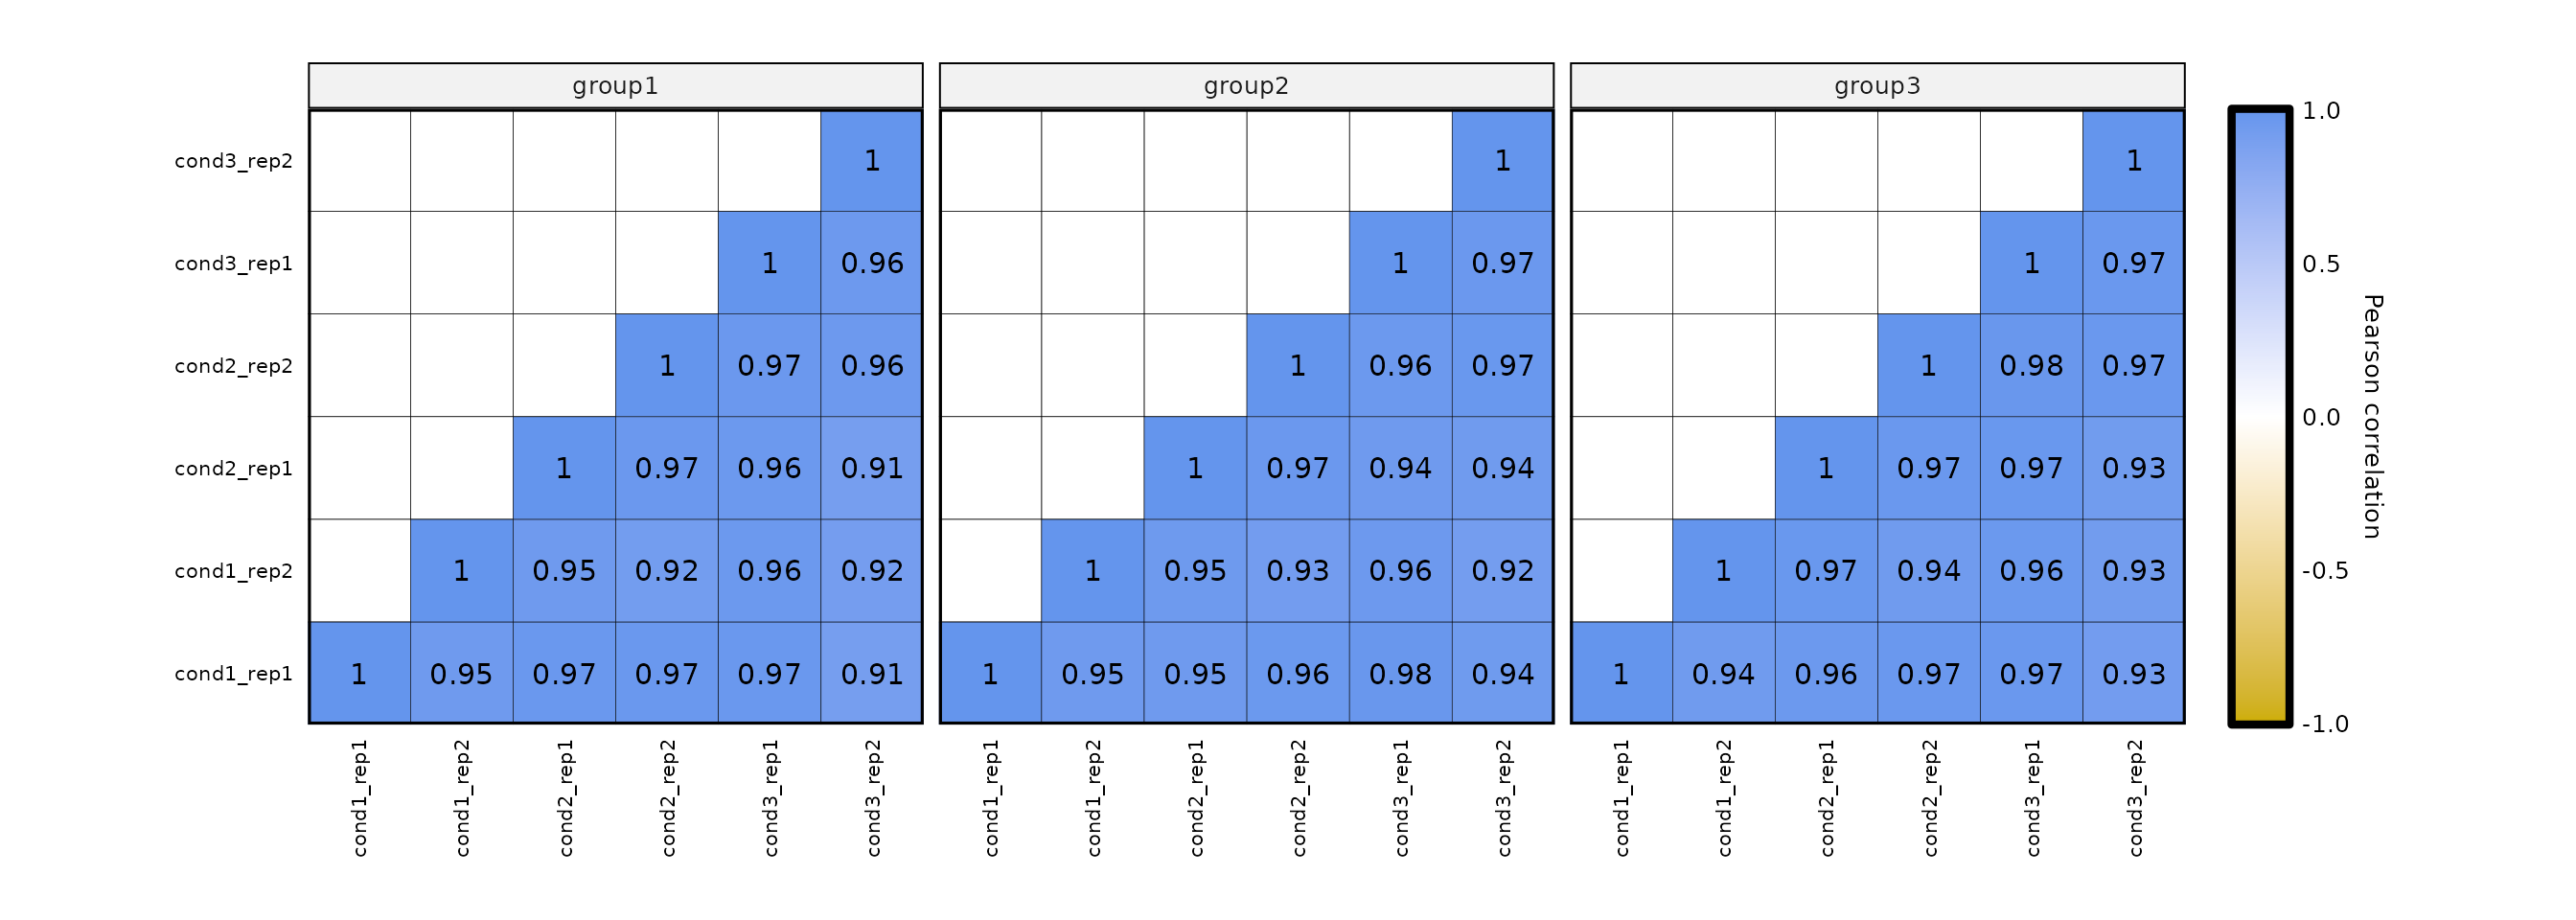
Options
In expressionCor(), the default is to compute the Pearson correlation. Nevertheless, the correlation method can be changed to Spearman or Kendall correlations by changing the corr_method argument to "spearman" or "kendall".
expressionCor(df = expr, corr_method = "pearson") + labs(title = "Pearson correlation (default)") +
expressionCor(df = expr, corr_method = "spearman") + labs(title = "Spearman correlation")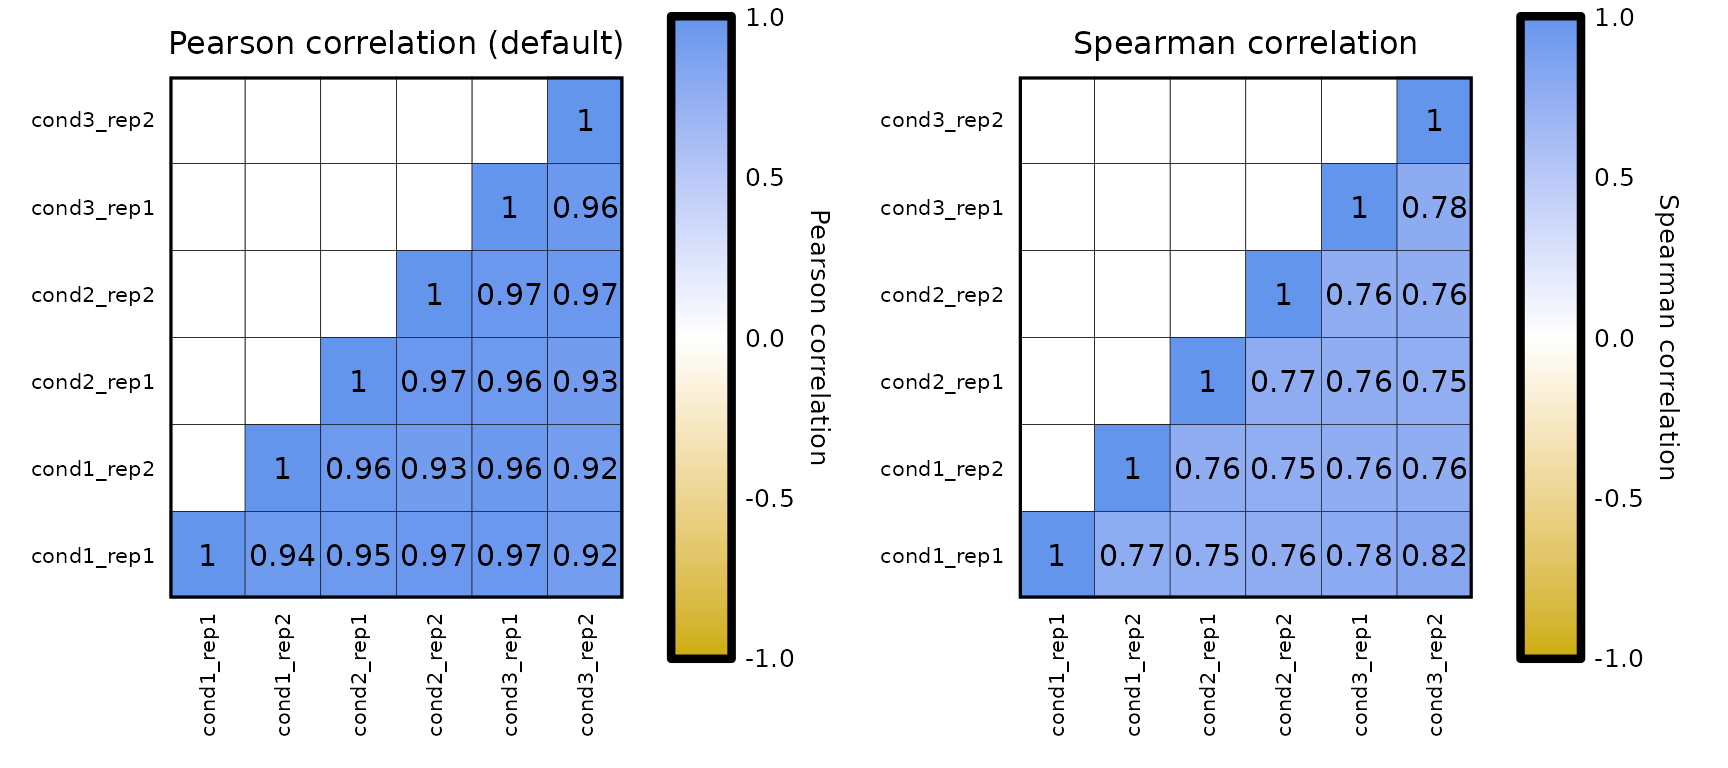
Also, the genes and/or samples used to compute the correlation values can be subset using the genes and samples parameters.
expressionCor(df = expr, genes = c("WASH7P", "FAM138A", "AL627309.1")) + labs(title = "Subset of genes") +
expressionCor(df = expr, samples = c("cond3_rep2", "cond1_rep1", "cond2_rep1")) + labs(title = "Subset of samples")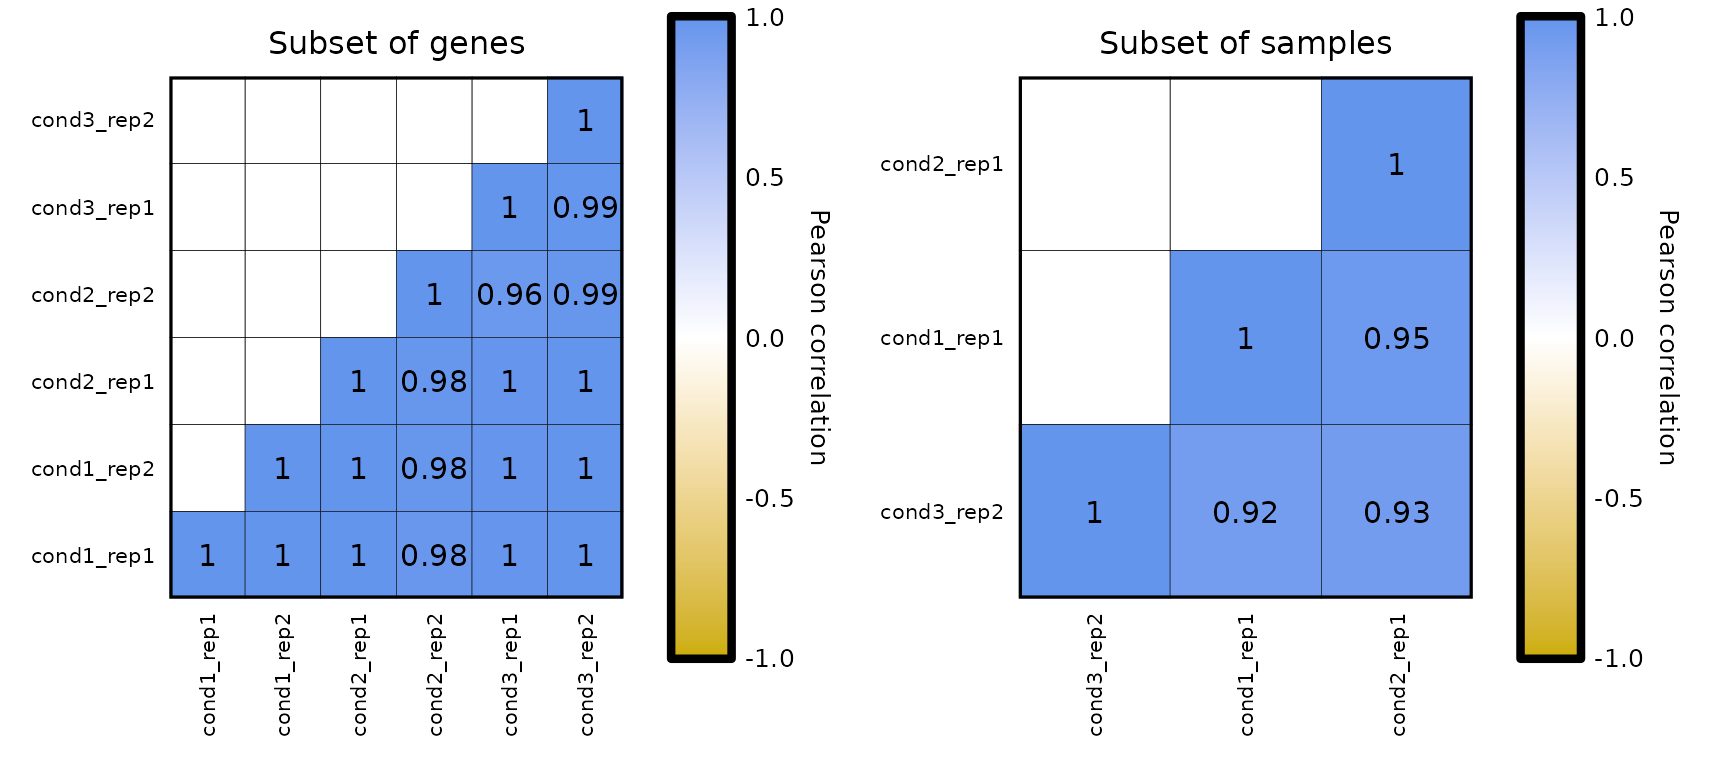
Customization
Heatmap
expressionCor() allows an easy customization of the heatmap:
-
Plot type:
- by default,
expressionCor()plots only the lower part of the matrix (since it is symmetrical), including the diagonal. - setting the parameter
plot_typeto"upper"(plots the upper part of the matrix) or"full"(plots the whole matrix), the plot type can be changed.
- by default,
expressionCor(df = expr, plot_type = "lower") + labs(title = "Lower plot (default)") +
expressionCor(df = expr, plot_type = "upper") + labs(title = "Upper plot") +
expressionCor(df = expr, plot_type = "full") + labs(title = "Full plot")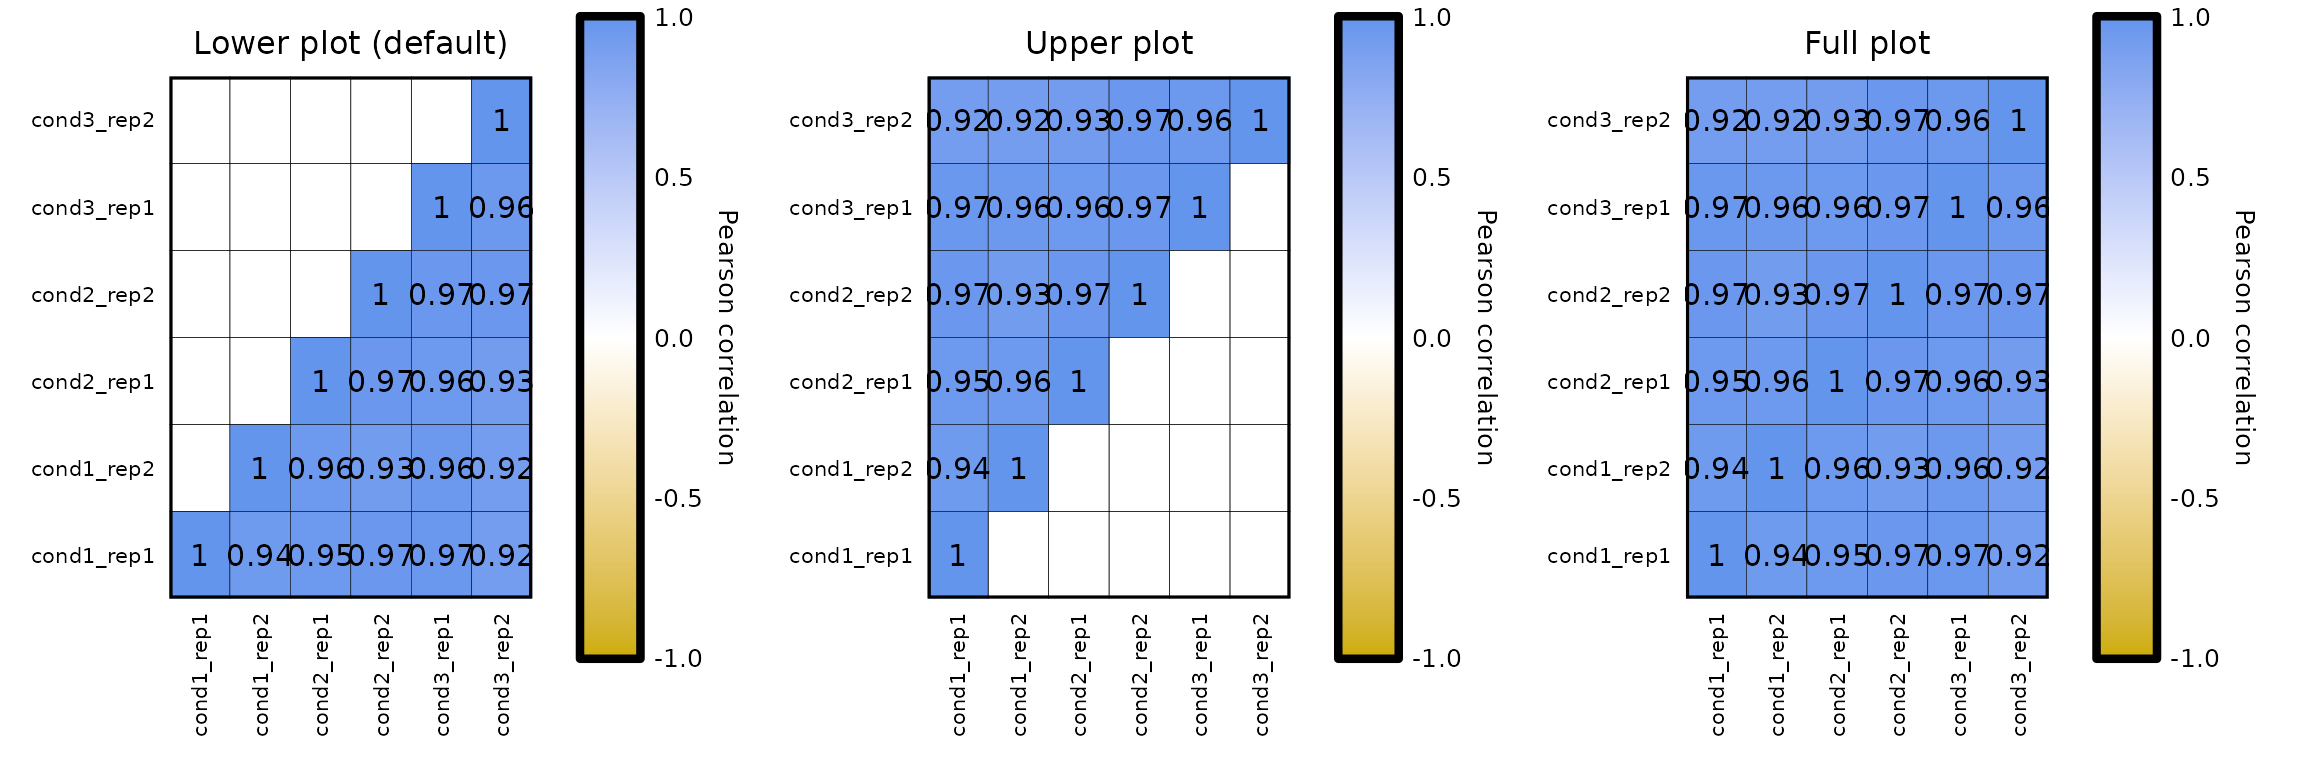
-
Diagonal:
-
expressionCor()plots the diagonal by default. - by setting
plot_diagonal = F, the diagonal is not drawn.
-
expressionCor(df = expr, plot_diagonal = F)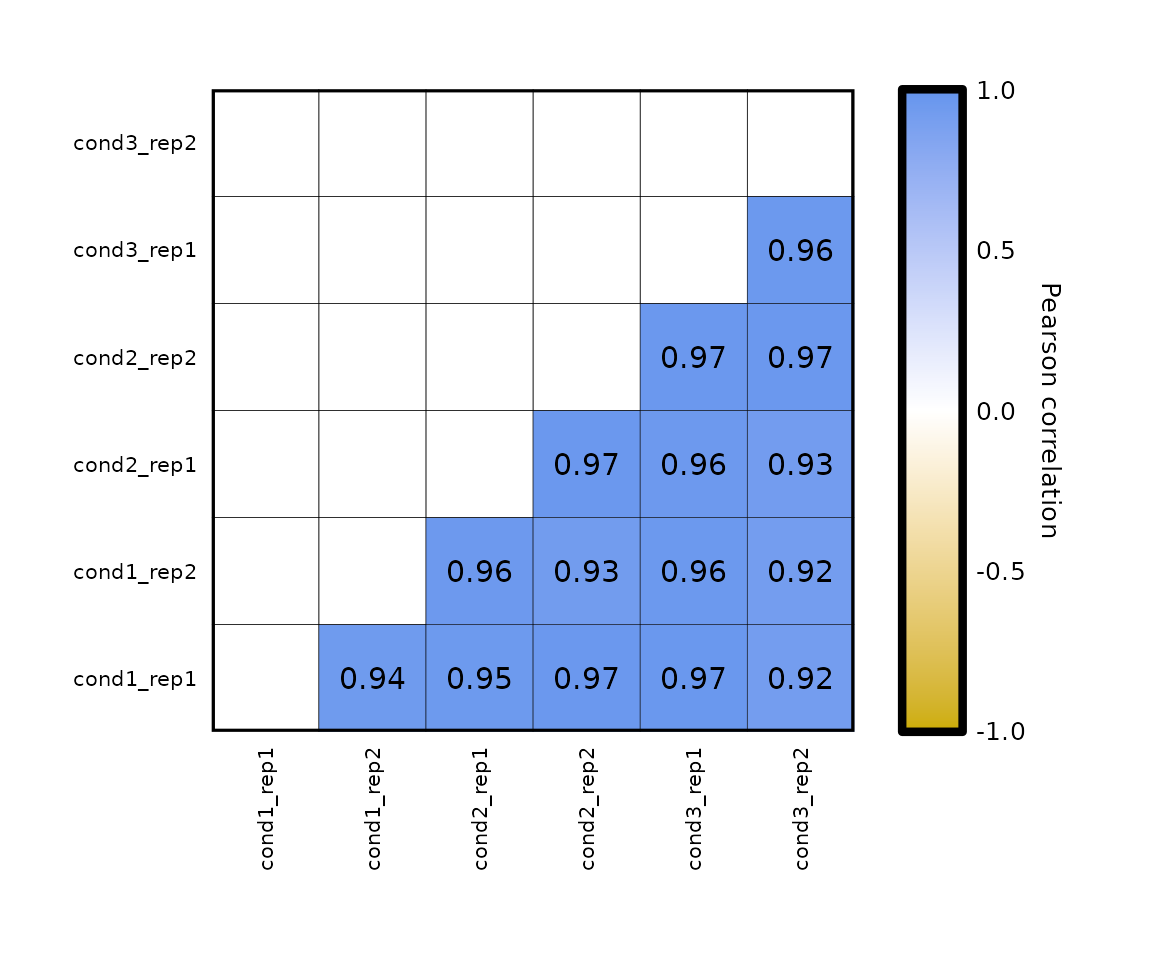
-
Correlation values:
-
expressionCor()allows changing the coefficients color with the parametercoeffs_color, which is black by default. - the correlation coefficients can be removed from the plot if
coeffs_coloris set toNULL. - the parameter
coeffs_sizeallows the customization of the coefficients size, which is 4 by default.
-
expressionCor(df = expr, coeffs_color = "Black") +
expressionCor(df = expr, coeffs_color = "Red", coeffs_size = 6)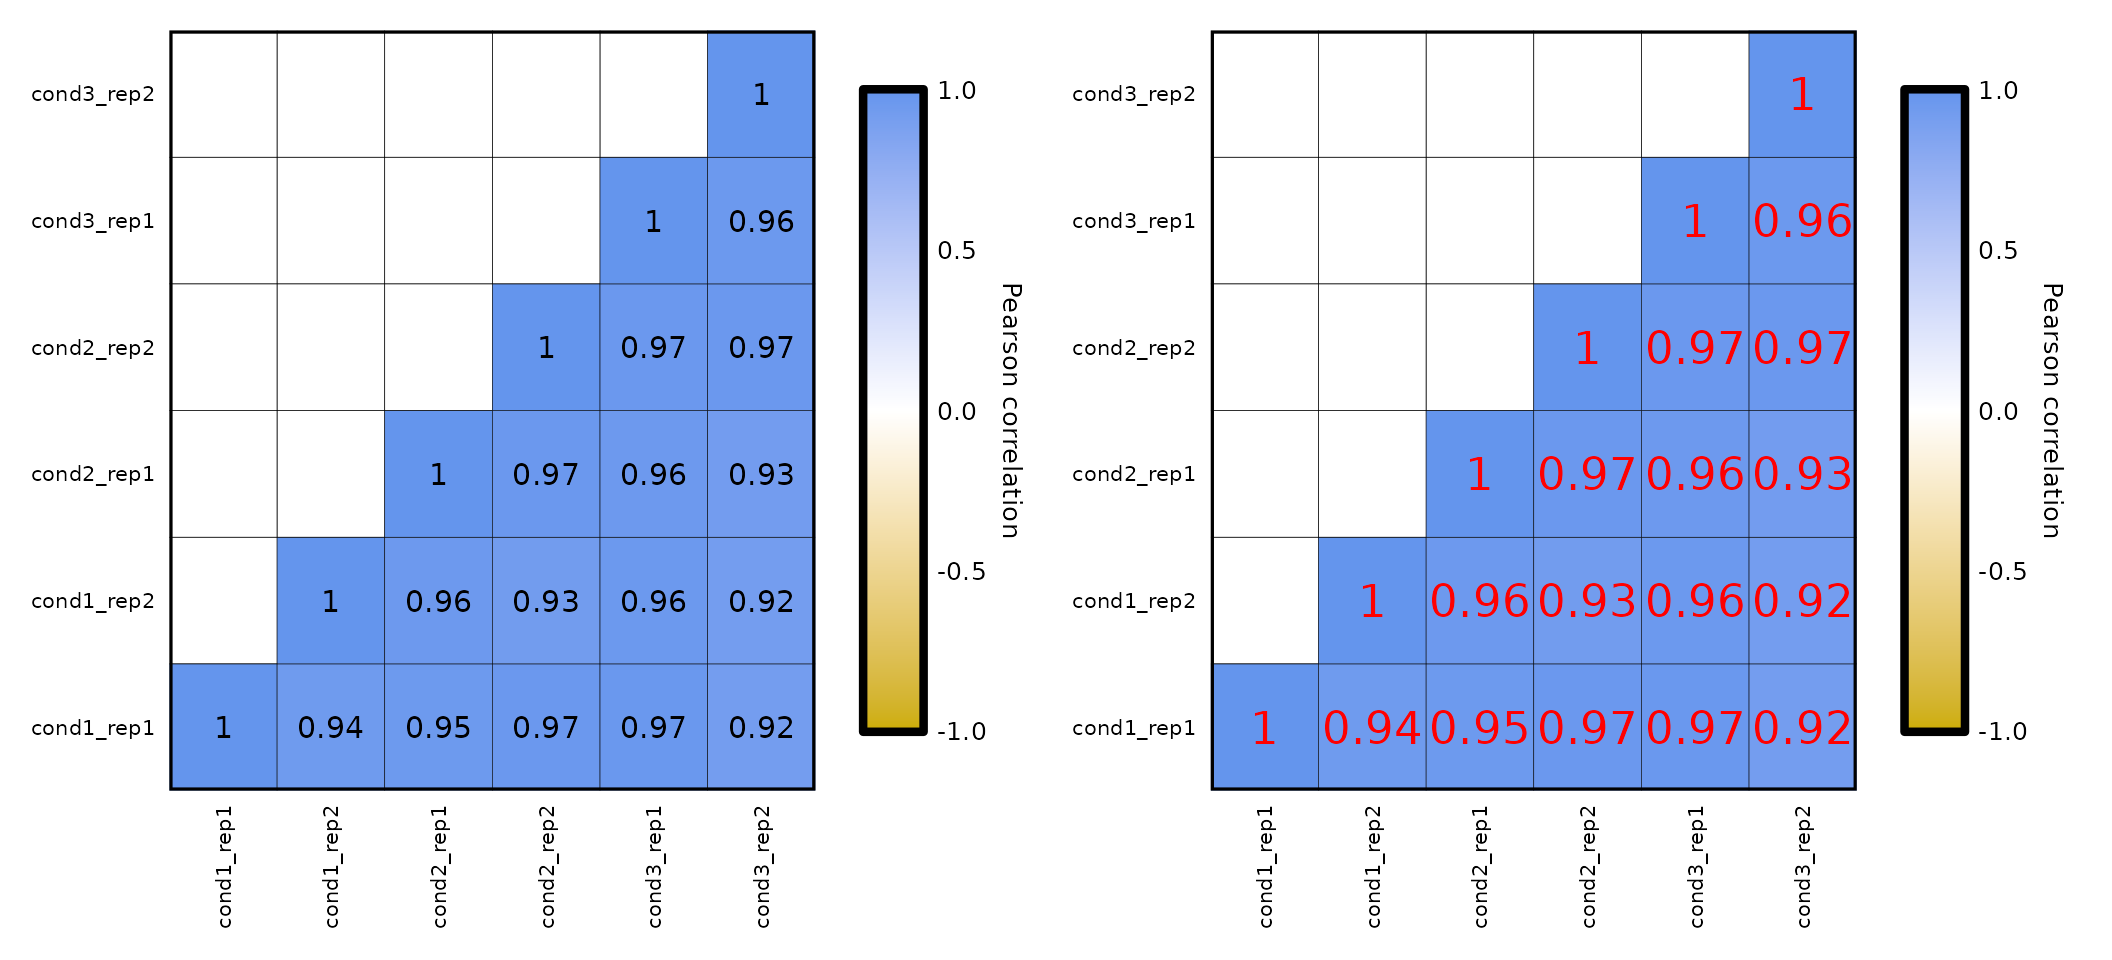
-
Colors:
- the colors of the plot can be changed by setting the parameter
plot_colorswith a character vector with 3 valid R colors. - the values from
plot_colorswill be passed toscale_fill_gradient2()to set the color of the limits and the midpoint.
- the colors of the plot can be changed by setting the parameter
expressionCor(expr, plot_colors = c("blue", "yellow", "red"))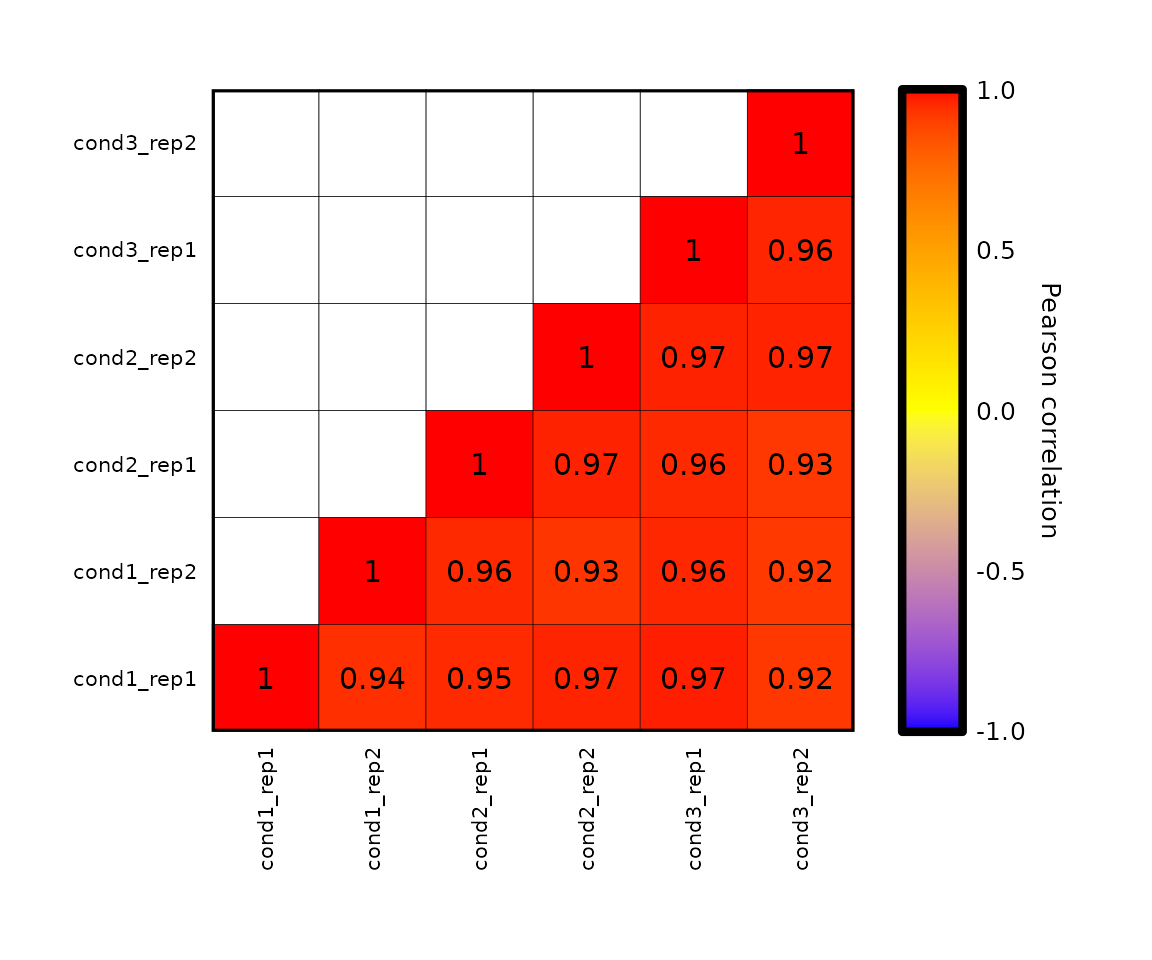
-
Size:
- the size of the heatmap (both with and height) can be changed with the parameter
plot_sizewhich, by default is 85 (millimeters). - changing the plot size, will automatically change the legend size to adjust it to the height (if the legend is vertical) or width (if the legend is horizontal).
- the size of the heatmap (both with and height) can be changed with the parameter
expressionCor(df = expr, plot_size = 50)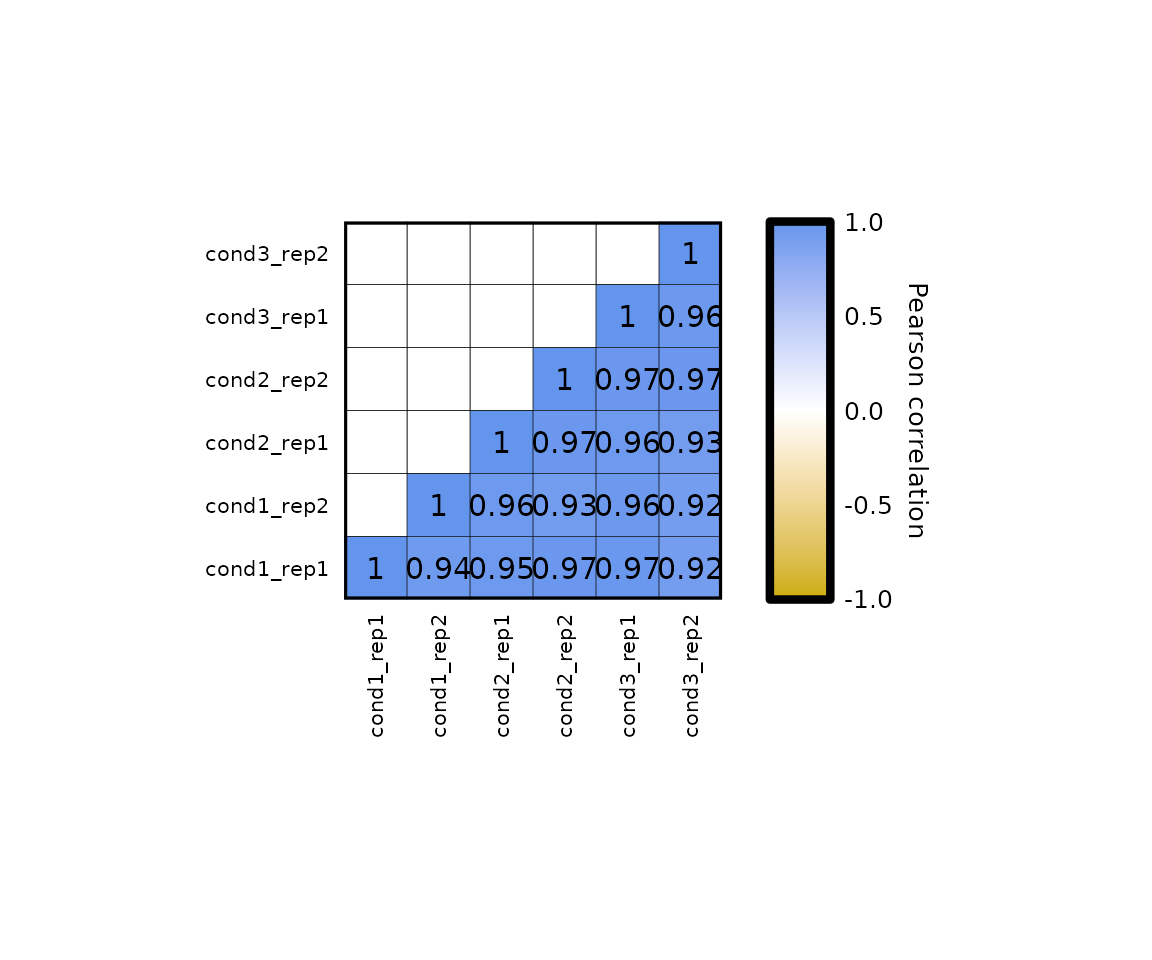
-
Title, subtitle, caption:
- the parameters
plot_title,plot_subtitleandplot_captionallow to specify the title, subtitle and caption of the plot, respectively. - also, the text of the title, subtitle, caption can be formatted with the parameters,
title_hjust,title_face,title_size,subtitle_face,subtitle_size,caption_size.
- the parameters
expressionCor(df = expr, plot_title = "Title", plot_subtitle = "Subtitle", plot_caption = "Caption")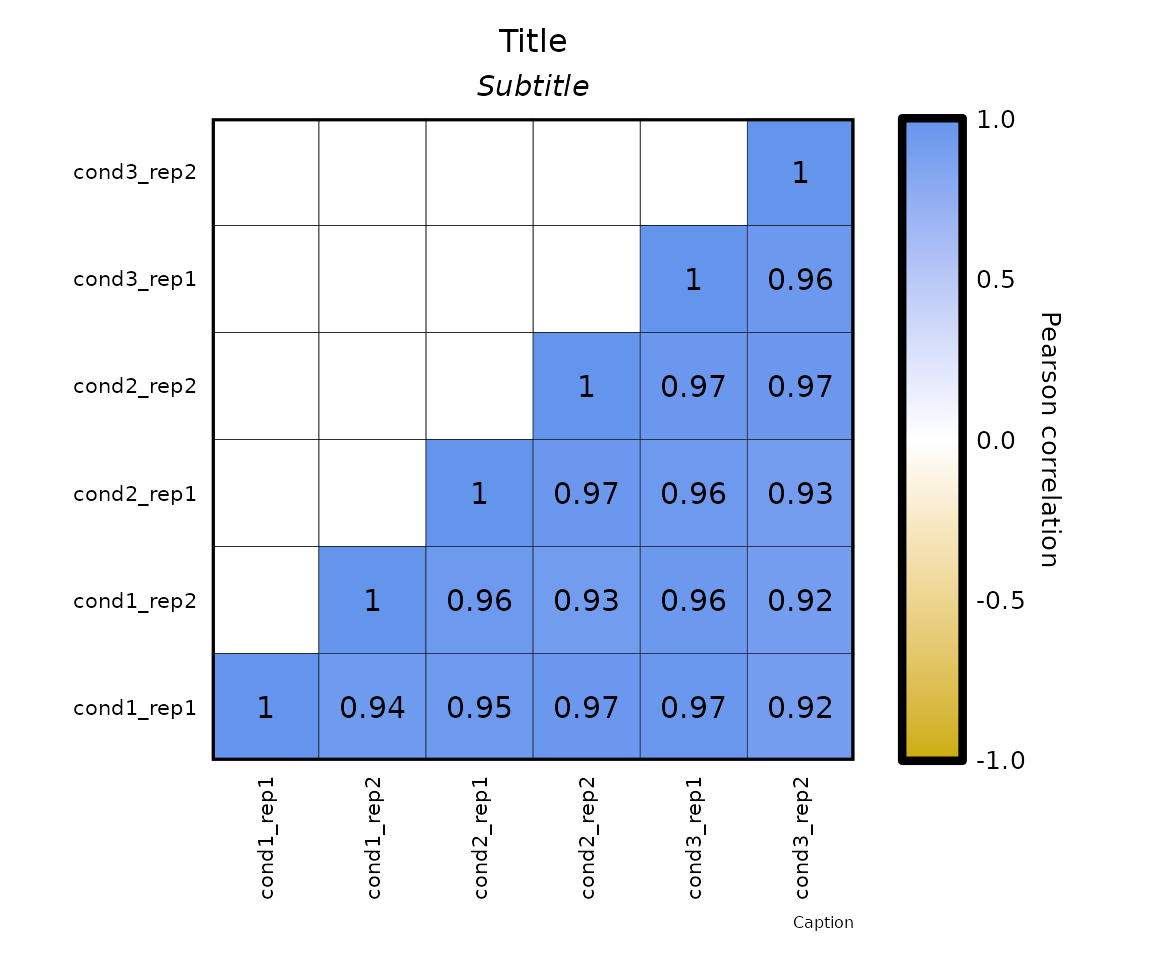
-
Axes:
- the text in the axes can be formatted with
axis_text_colorandaxis_text_size
- the text in the axes can be formatted with
expressionCor(df = expr,axis_text_color = "blue", axis_text_size = 7)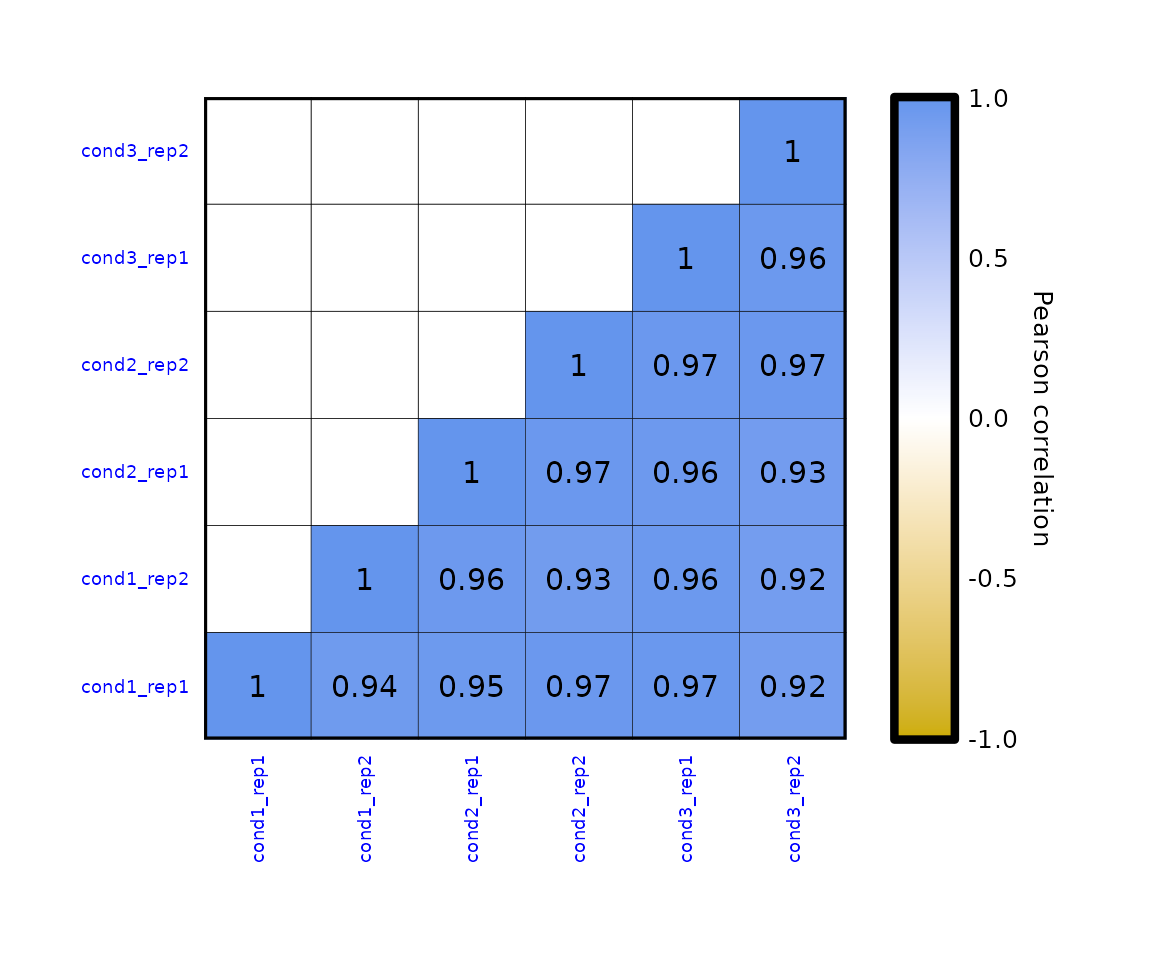
-
Cell border:
- the parameter
cell_borderallows to set the color of the cell border which, by default is gray. It can be set to a valid R color or to a character “NA”, which removes the border.
- the parameter
expressionCor(df = expr) +
expressionCor(df = expr, cell_border = "Red") +
expressionCor(df = expr, cell_border = "NA")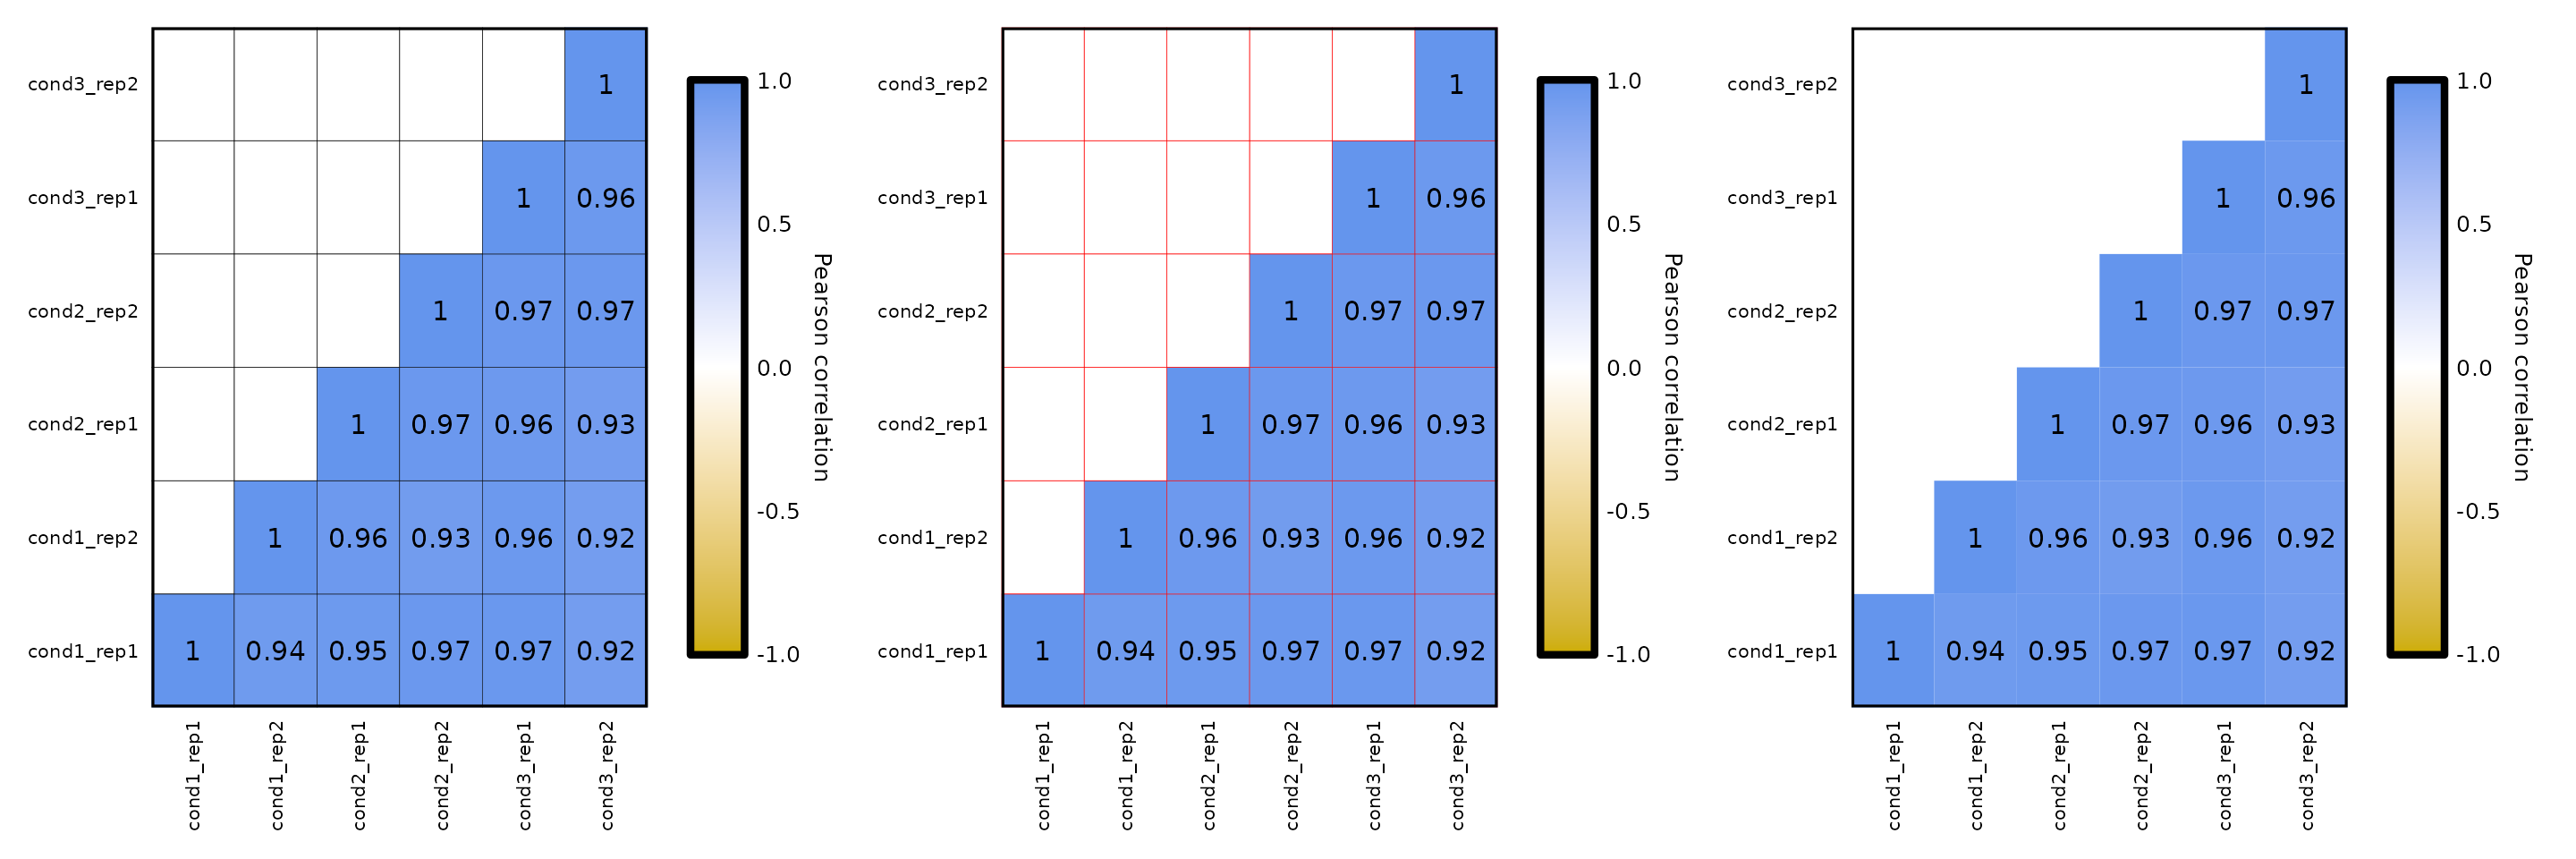
Legend
expressionCor() allows an easy customization of the legend:
-
Legend limits:
- by setting the parameters
legend_limitsandlegend_breaks_by, you can change the legend scale which, by default, goes from -1 to 1. - the legend midpoint is automatically set to the mean of minimum and maximum values.
- by setting the parameters
expressionCor(df = expr, legend_limits = c(0.9,1), legend_breaks_by = 0.05)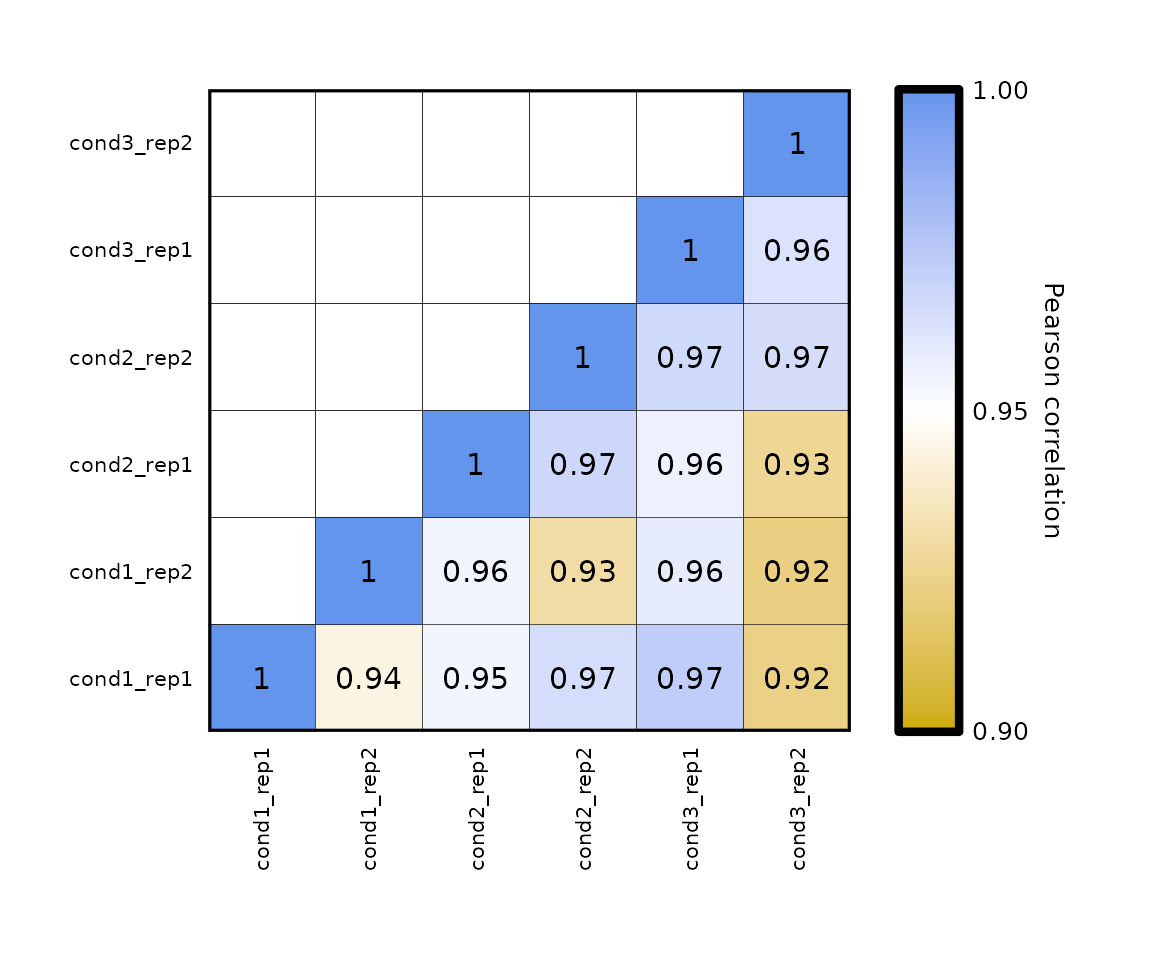
-
Legend title:
- change the
legend_titleparameter which, by default, is set to the correlation method used (e.g. if the correlation is Pearson’s, the title is Pearson correlation).
- change the
expressionCor(df = expr, legend_title = "Title of the legend")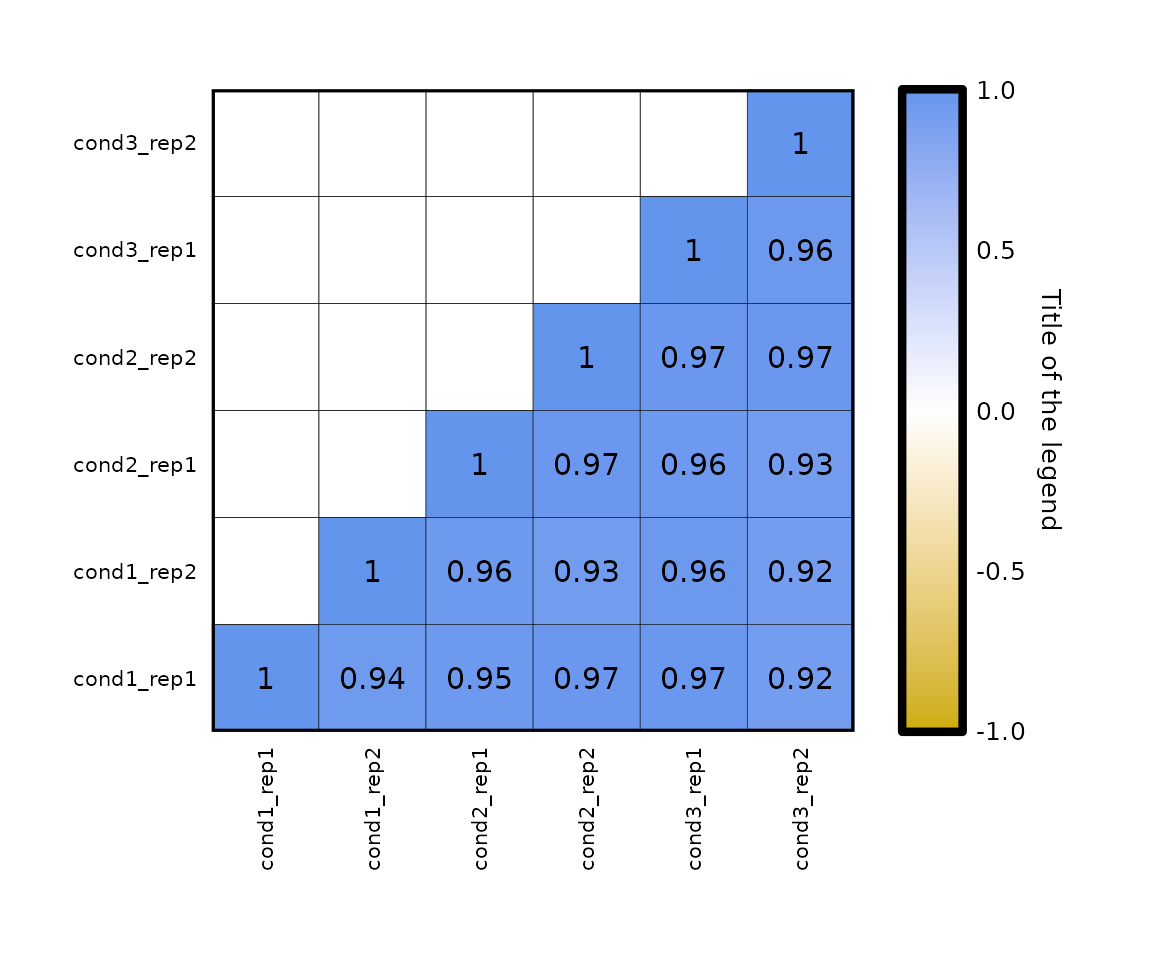
-
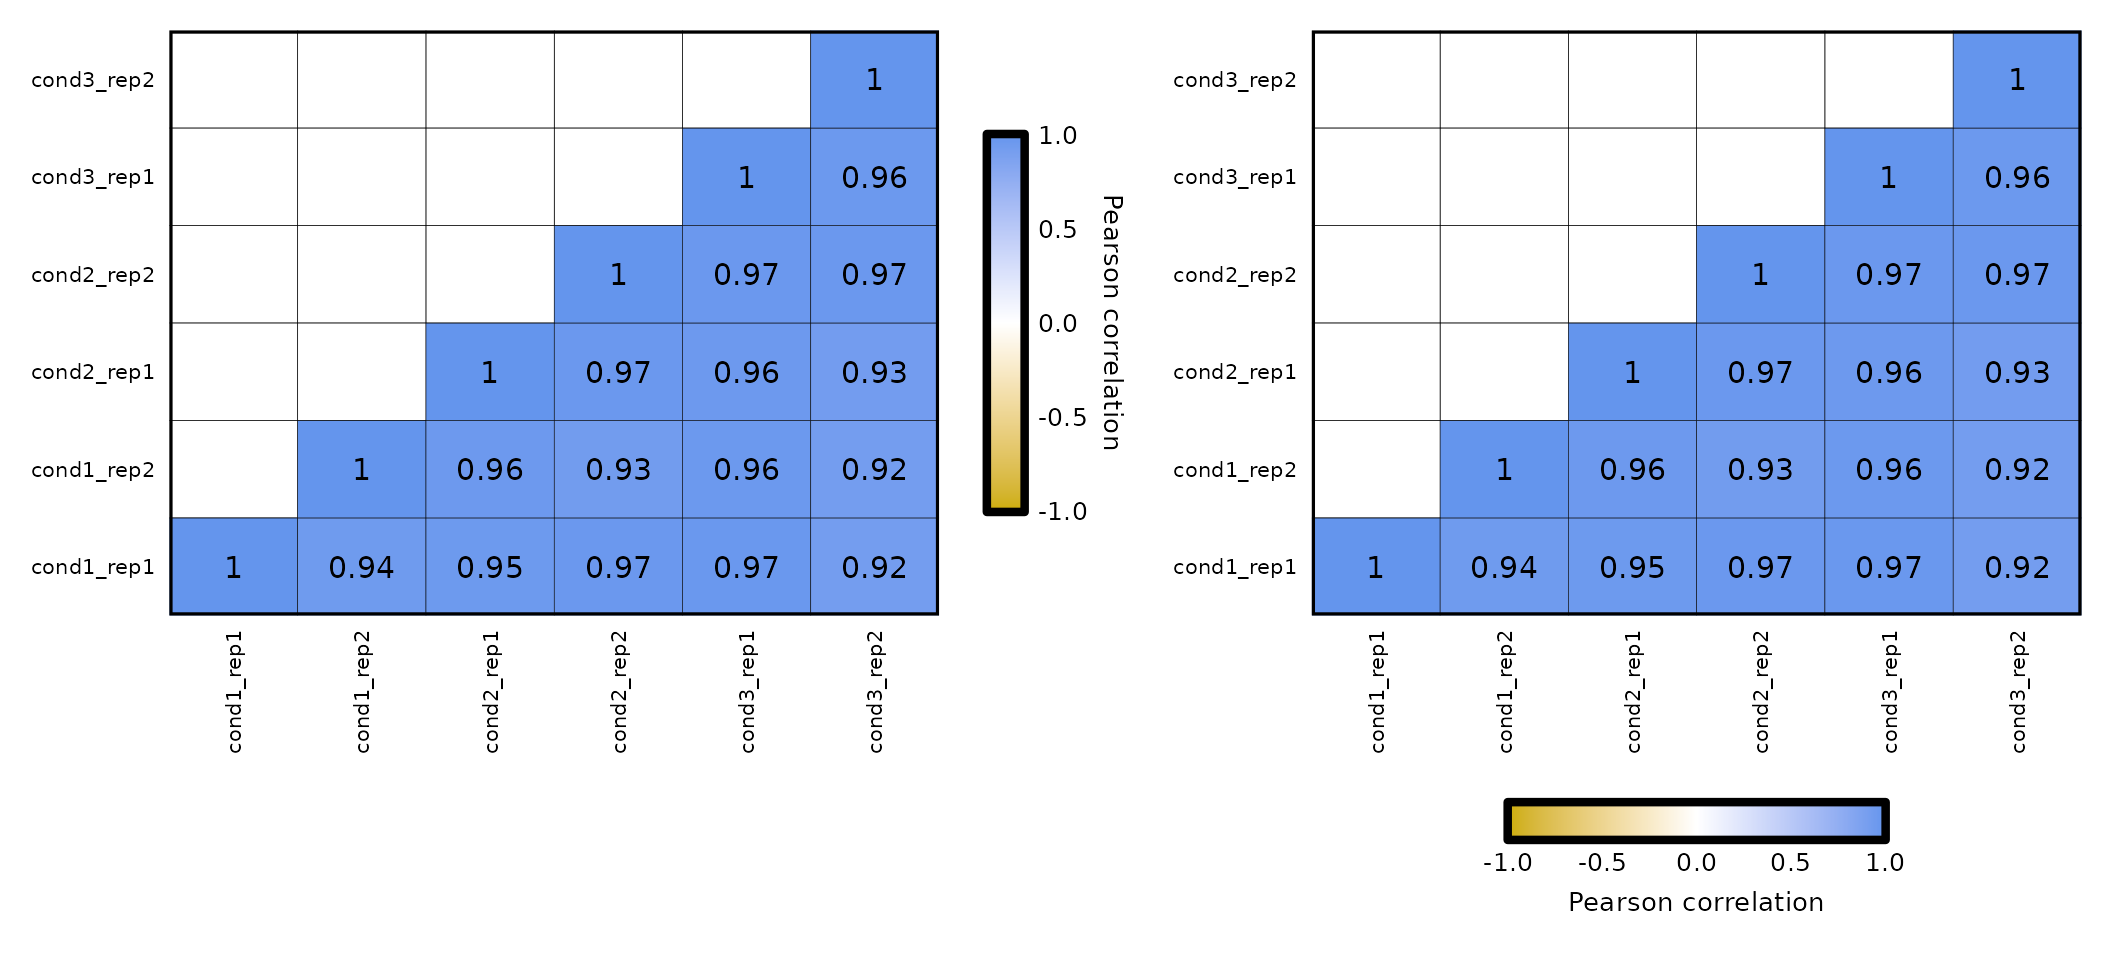
Position of the legend:
- the
legend_posparameter allows to position the legend to the left, right, top or bottom.
- the
(expressionCor(df = expr, legend_pos = "left", legend_title = "Legend at the left") +
expressionCor(df = expr, legend_pos = "right", legend_title = "Legend at the right")) /
(expressionCor(df = expr, legend_pos = "top", legend_title = "Legend at the top") +
expressionCor(df = expr, legend_pos = "bottom", legend_title = "Legend at the bottom"))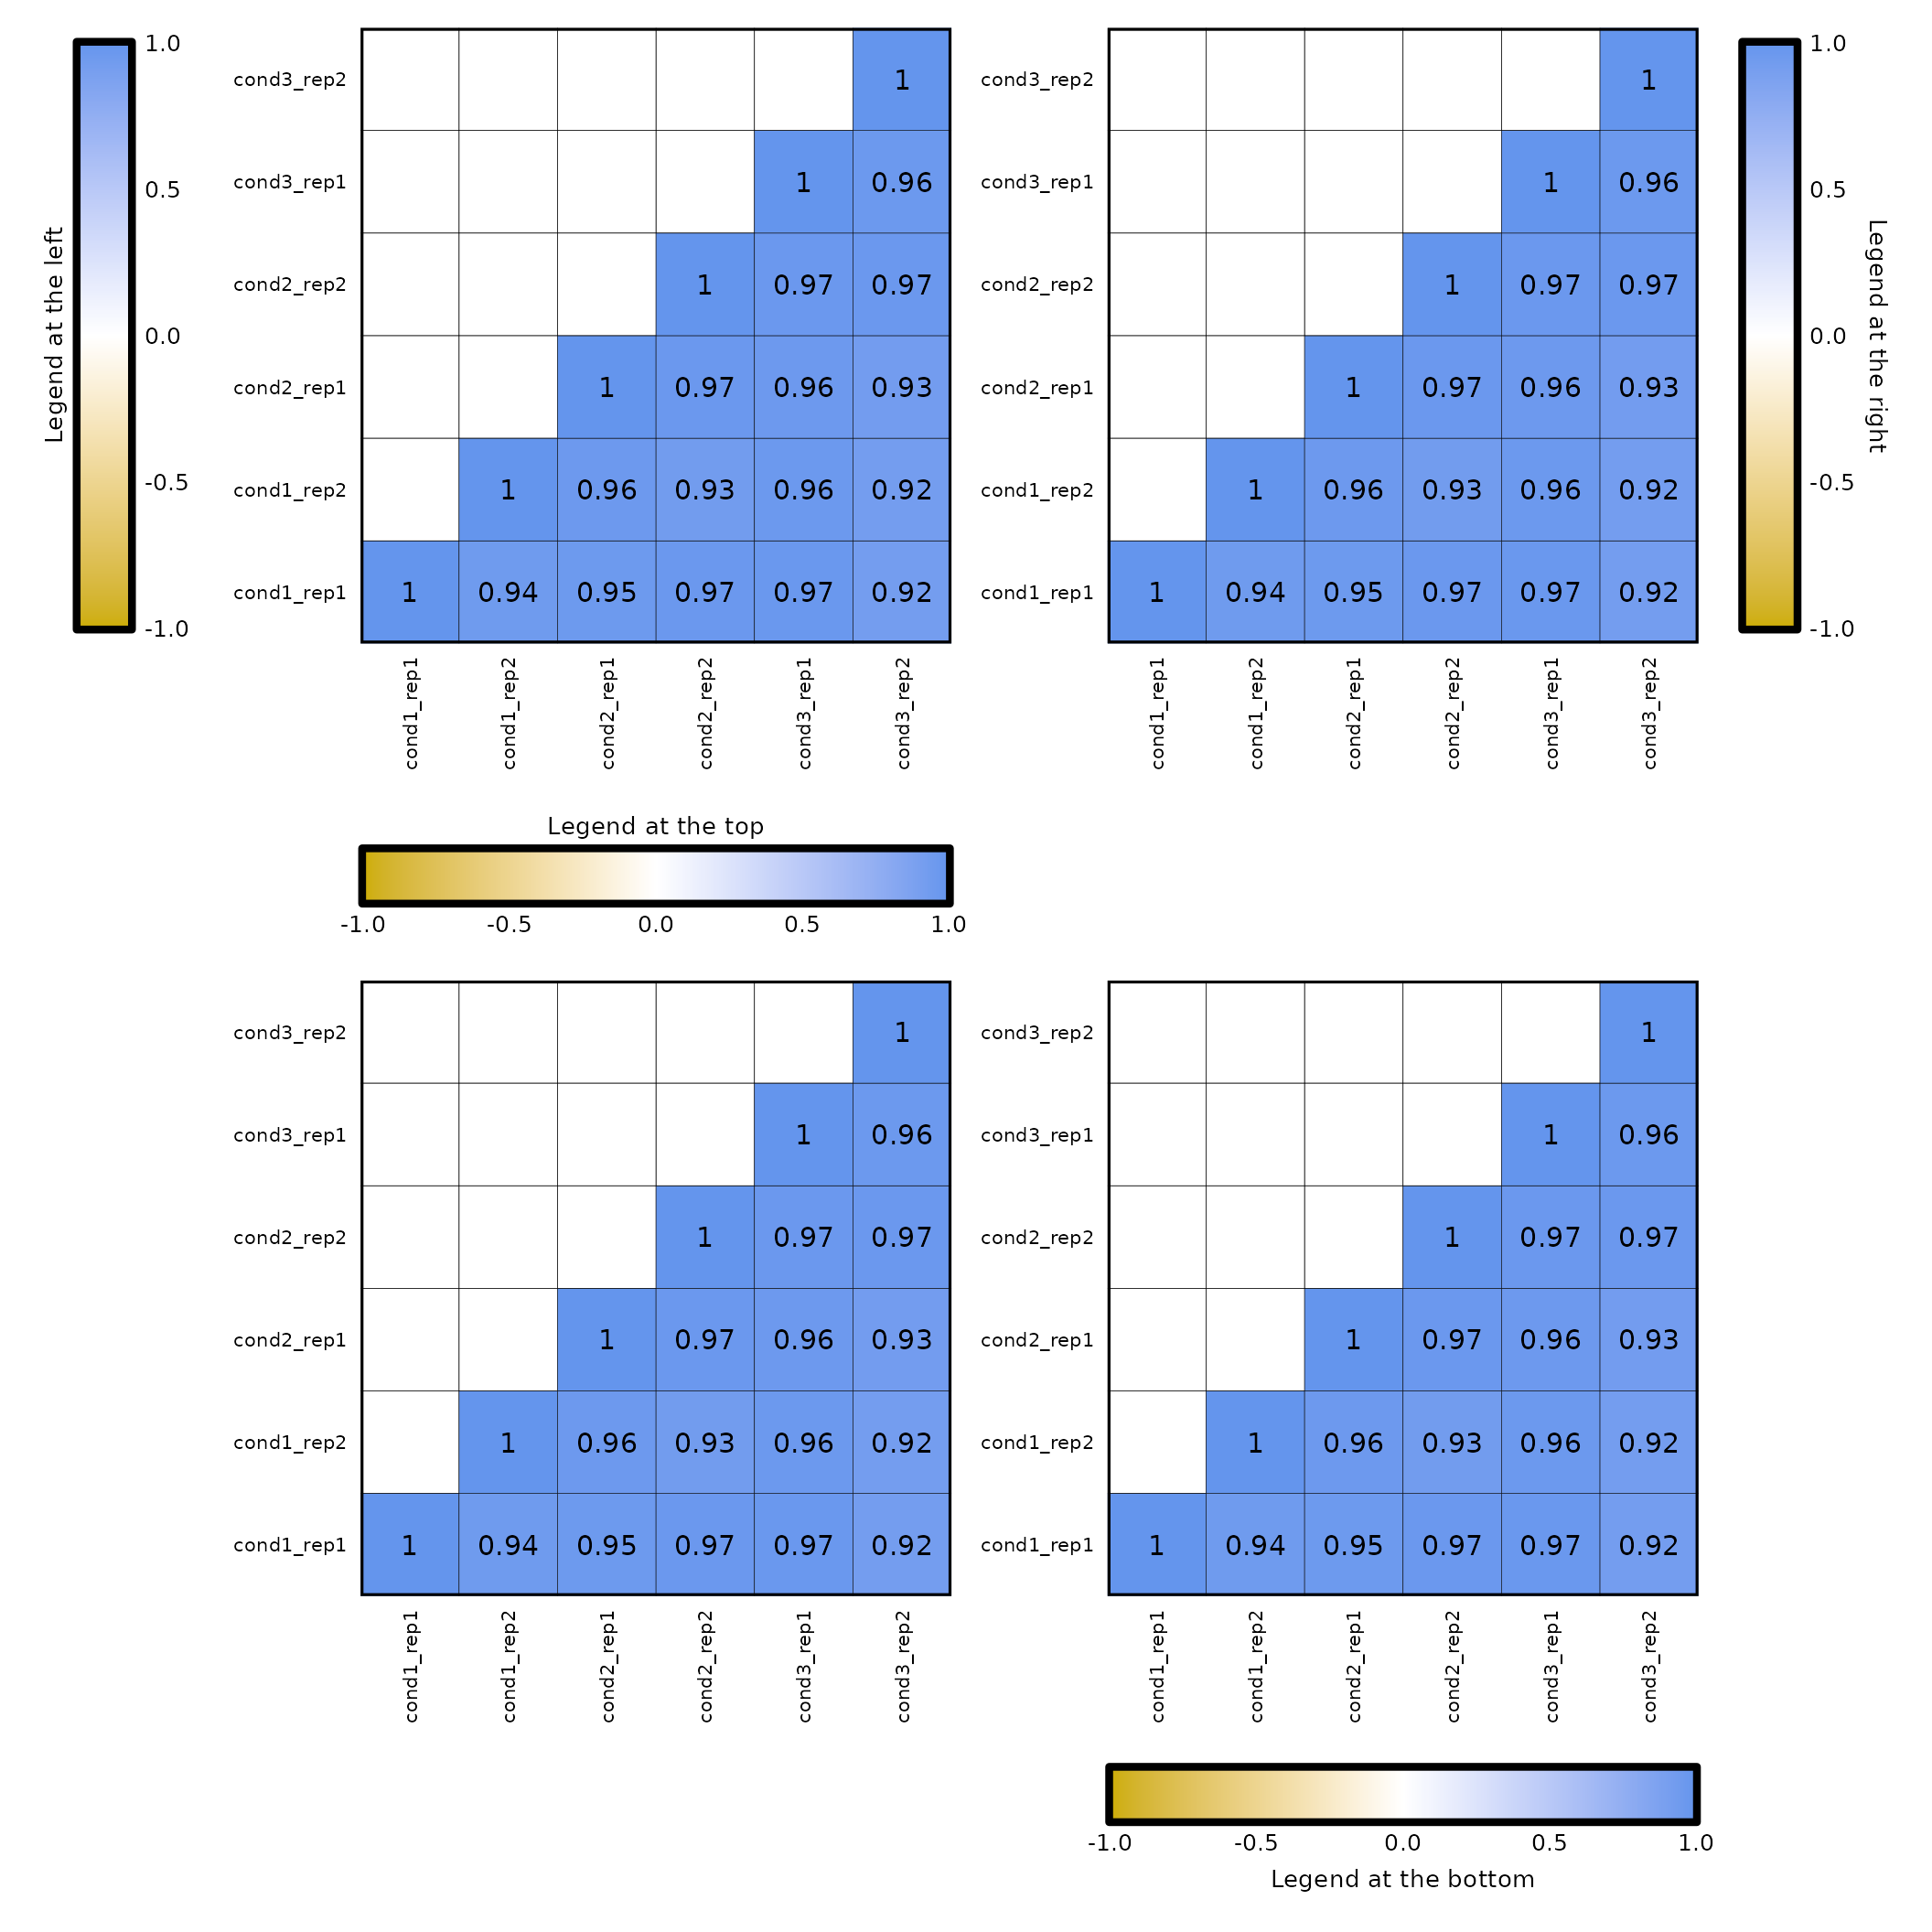
-
Legend size: by setting the parameter
legend_sizewith a numerical vector of length 2, the size of the legend can be changed.- If the legend is vertical (i.e., at the left or at the right), the first number is the width and the second is the height of the legend, in millimeter.
- If the legend is horizontal (i.e., at the top or at the bottom), the first element is the height and the second is the width, in millimiters.
- By default, the legend size equals to the heatmap size.
expressionCor(df = expr, legend_size = c(5,50)) +
expressionCor(df = expr, legend_pos = "bottom", legend_size = c(5,50))